


The Wolf Den #48 - The Value Of Time, Bitcoin, Make A Million Dollars

Bitcoin Thoughts And Analysis
The Bitcoin charts are muddled for me, as I can see an argument in both directions on shorter time frames. The larger time frames look bullish, so in my eyes any drop is still a buying opportunity. I do not really consider the halving in my analysis, but those who do will likely want to be careful with that event coming in a week. It could lead to some serious volatility, although I do not dare to guess in which direction.
I took a small short a few days ago, which I closed for a very small profit yesterday. Right now, I am more interested in longing a dip or clear breakout.
MONTHLY CHART
Beautiful monthly candle to close April. Price held the $6,540 support, broke $7,777 after consolidating there for days and then pumped to the next level at $9,243. I have had these levels drawn for ages, as you know. The May candle has topped out at that key level almost to the dollar.
April's candle close above March's, after March had the huge down wick. This can be viewed as confirmation of a bullish trend.
WEEKLY CHART
K.I.S.S. - Keep it simple, stupid. I removed most of the lines from the weekly chart, because on this time frame there's not much to see. Price broke above the pink line, which was clear resistance and has held there thus far. There is a well defined supply zone above, drawn off of the last bullish candle before the major 3 week downtrend. It looks like clear sailing to that area based on the weekly time frame. Notably, volume was decreasing with price increasing for many weeks on the way up. Last week saw the first clear bump up in volume during this uptrend, which is very encouraging and quite bullish. We want to see volume continue to rise this week.
DAILY CHART
I drew this last week and still have not really changed my bias. That said, I can't find a convincing reason to be short or long at the current moment. That blue zone is still a potential bullish breaker, which I have explained in last week's issue. A retest of that as support would be really bullish for future movement. Right now, it's clear that a break above $9,214 is necessary for continuation. I still have my orders from $7,900 to $8,200, based on the weekly and daily charts. I will buy higher if we break out.
There is confirmed bearish divergence with RSI on the daily chart, which is why I shorted a few days ago (which I closed for a small profit yesterday). RSI is overbought, which usually leads to some retracement. However, it has been this way for a couple of days now, so it's not so convincing.
TD Sequential printed a green 9 a few days ago, a clear sell signal for those who use this indicator. The count can extend to 13 candles, which is where we are today. Will be very interesting to see how this plays out. Another confirmed green candle would cancel the 9. Usually a daily 9 is a reliable indicator of a future move, which was another reason I initially shorted. Watching this closely.
4-HOUR CHART
This looks bullish, right? A clear bull pennant forming after a significant move up. The target is shown in pink, which is based on the length of the flagpole. This is an estimate, because it is dependent on where the breakout occurs. Of course, it has to actually break out first.
The Wolf Of All Streets Podcast Ft. Steve Ehrlich

Steve Ehrlich, CEO of Voyager and ex-CEO of ETRADE Professional Trading and I discuss the challenges of running a publicly traded crypto broker in the United States, the lessons learned from playing sports, the fungibility of crypto, security and safety, how to reach mainstream adoption, whether institutional money is in crypto, infinite QE and money printing, running a company during the COVID-19 pandemic, the March 12th crypto crash and much more. Steve is a true wealth of knowledge who has been building financial tools for decades - you don't want to miss this one.
Legacy Markets
The stock market is finally trading somewhat sideways after his huge gains over the past few weeks. My bias has in no way changed.
Here are my current stock short positions with entries. You can refer to the last issue to see the charts, if you are interested.
BRK.B - $196.9
TSLA - $800
BA (Boeing) - $134
SPY - $288.62 average entry
BA (BOEING)
I readjusted the bear pennant after a bit of recent price action. I like the lines as they are here - it is clear that support has broken and the last 2 daily candles (today not closed) have tested it as resistance. The top of the pennant is in confluence with the 38.2% fib retracement level. Every stock trade is risky with the current volatility and irrational exuberance, but from a chart perspective, this is a textbook short.
SPY
SPY is the main asset that I invest in, dollar cost averaging monthly regardless of price. It is an ETF that tracks the S&P, so charting it is a good way to chart the market overall, since it is actively traded (unlike the Dow Jones chart).
Same chart as before. Price has retraced the move down back up to the 61.8% fib and beyond AKA the golden pocket. Volume continues to decrease with rising price, a sign of bearish consolidation, not a bull trend. Price is in an area with a few key support and resistance levels. I still think this is going to drop, which is why I am short as a trader.
XAU (GOLD)
Just an update, not a trade. Gold managed to successfully close the monthly candle above the ascending channel. You can see that 3 previous months wicked above but were unable to finish the job. Price also wicked into the major supply zone shown in April, before closing right near the bottom. The May candle is fresh, but is starting to follow through into that zone. A clear break of that area and flip to support would be mega bullish for Gold.
Trading Tip - Know Yourself And Your Strengths
Nobody is good at everything, but everybody is good at something.
I know that cliche sayings like this can sound contrite, but in this case it really is true. As a trader, you need to do what works best for you.
Scalping and trading low time frames is fun, but does not suit my lifestyle or personality. Because I have a family and like to dedicate my time to things other than trading, I prefer to analyze a few charts, identify areas of interest and take trades that are likely to take multiple days or weeks to complete.
For me, this is easy.
There are people who can stare at 5 minute chart, 16 hours a day and make profitable scalps. That does NOT work for me or suit my temperament.
You need to know yourself.
Reflect on your past experiences and identify when you’ve been in the zone, and what that looks like. Think of the circumstances that led to your excellent performance.
And then compare it to the times you were unhinged, unsure, and deviating from your trading plan. What was different?
Why did you do better in one environment than the other?
Learn which circumstances set you up for success, and then maximize your exposure to those circumstances. The exact answer here will vary for each individual, and that’s a good thing!
And remember, these lessons all intertwine with each other. So find your strengths in all areas of life, which you’re pursuing independent of your trading for balanced fulfillment and meaning.
Make A Million Dollars By Passively Investing
As a new investor, it’s important to understand the term “passive” in relation to investing. The main goal of passive investing is to buy and hold stocks over the long haul. Once shares are purchased, no matter what happens to the price, you do not sell.
As I said last week - time in the market is better than timing the market.
Passive investors consistently buy more shares, ideally each month, on a fixed date regardless of price. This is often called "dollar cost averaging" or DCA. By holding over the long haul, the power of compounding takes over. There are also tax benefits to holding long term, but that’s a topic for a different day. I average into SPY, AMAZON and select mutual fund targeted to my retirement age. I also dollar cost average into Bitcoin and Ethereum, but that's also a topic for another day.
While you can passively invest in any stock, the most common strategy is to invest in the overall stock market, e.g., the S&P 500. This way, you are diversified, which means owning shares of stocks in multiple industries or segments of the economy.
Historically speaking, over the past 90+ years, the S&P 500 has appreciated 9.6%, on average, each year. Certainly, some years are better than others (the S&P 500 fell -37% in 2008 and just as much this year) but over the long haul, the US economy grows in size, and with that, stock prices appreciate in value.
There are five key benefits of passively investing in the overall stock market:
You can sleep well knowing you are diversified and own the entire stock market instead of just one single company.
By buying and holding for decades, while reinvesting dividends, the power of compounded returns is realized.
With passive investing in low cost index funds (ETFs or mutual funds), you are keeping fees as low as possible, which maximizes your returns.
You are maximizing tax efficiency by buying and holding for decades instead of days (traditional, taxable account… not a retirement account).
You remove all the emotions of second guessing yourself by keeping your investing approach simple.
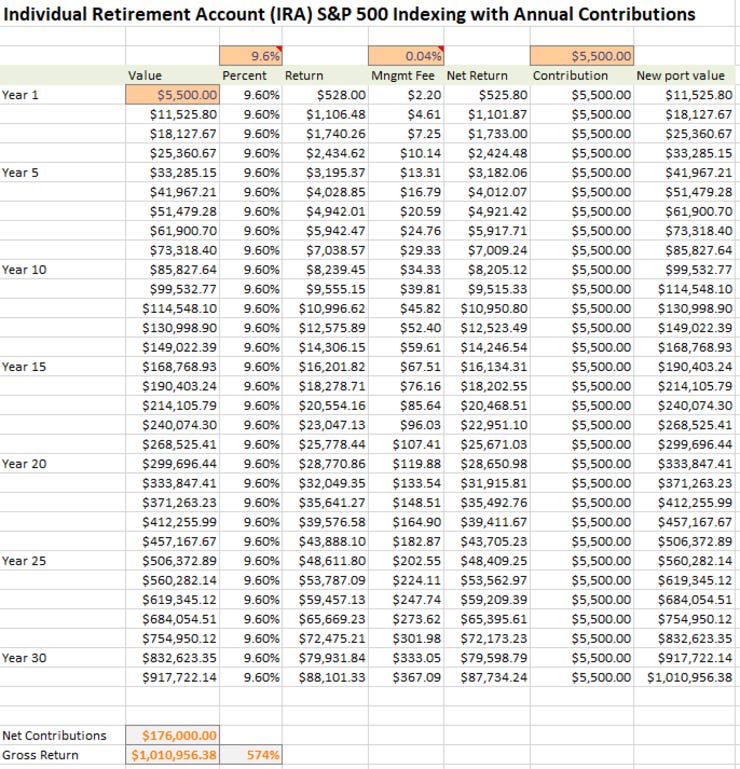
To illustrate just how powerful passive investing is, I found a basic spreadsheet that shows how putting $5,500 into an Individual Retirement Account (IRA) and investing the entire amount each year in Vanguard’s S&P 500 ETF (symbol “VOO”). As of 2019, $5,500 was the maximum until 2019 - as of 2020 you can contribute $6,000 each year into an IRA, so this compounds much faster.
By investing $5,500 each year in a tax-deferred IRA and investing in the S&P 500, after 31 years you will have ~$1,000,000. You will only have invested $176,000 to get there.
THE POWER OF COMPOUNDING INTEREST AND INVESTING!
Crypto Companies Helping To Fight COVID-19
I found this to be an inspired read on some of the creative ways crypto companies are helping those in need during the COVID-19 pandemic.
Bitcoin Hashrate Hits All Time High - Again
Bitcoin hashrate has reached a new all-time with less than 8 days left until the much-anticipated Bitcoin halving.
According to data provided by on-chain market analytics firm Glassnode, Bitcoin’s hashrate soared over 140 exa hashes per second. The hashrate of a blockchain network measures the cumulative computing power within the network. With all-time high levels of Bitcoin hashrate, the network stands the strongest it has ever been. This is highly encouraging, after hashrate dropped over 40% in the March crash. The network is stronger than ever heading into the halving.
Bitcoin On Billions
Bitcoin is back on TV, once again finding it's way onto the show Billions. Past seasons featured mentions of crypto and even showed Bobby Axelrod handing over a Ledger hardware wallet. Once again, Bitcoin is painted in a negative light by "the law," that being antagonist Chuck Rhoades.
"So your multitude of computers can solve abstract math equations resulting in the mining of Bitcoin, worth millions right now but backed by what? Nada, nix…zat," said Rhoades during an interrogation.
On the flip side, the show exemplified the value of Bitcoin by showing that it was being heavily invested in by the Billionaire lead, Bobby Axelrod, who was funding the mining operation that was shut down.
Regardless of the context, it's very cool to see mainstream mentions of crypto and the space - it can only help! Check out the episode if you get a chance.
J. Crew Files For Bankruptcy
There's nothing inherently shocking about a major retailer filing for bankruptcy amid a global pandemic. It's still worth noting, because J. Crew is the first to file, and likely will be far from the last. The effects of the global economic shutdown are just beginning to be felt, and retail, which was a dying industry already, is likely to bear the brunt of the first wave of economic impacts. Even if malls reopen, how many people are realistically going to be heading to stores to buy clothes? Who even needs new clothes when they are working at home and have no events to attend.
This closure could be an early sign of a major paradigm shift in the way people shop and what those people are shopping for. This pandemic is going to change consumer behavior in ways that we can not yet foresee.
Malls are likely going to die. Stores are going to be primarily online (that was happening anyway).
Another reason to invest in Amazon.
Phemex
As a special offer to my readers, by signing up on Phemex with this link you will receive a 10% discount on trading fees for the next month. You will receive your discount as a rebate within 5 working days after the end of this offer’s duration.
Voyager
Voyager is my favorite crypto broker. You can trade crypto fast and commission-free. Earn up to 6% interest on top coins with no lockups and no limits. You literally earn interest on your holdings while you trade at a rate higher than you can get in any legacy bank account or fund.
This is where I personally invest in Bitcoin on a daily basis. They are a publicly traded company on the Canadian Stock exchange - I trust them implicitly to protect my funds.
https://www.investvoyager.com/
The views and opinions expressed here are solely my own and should in no way be interpreted as financial advice. Every investment and trading move involves risk. You should conduct your own research when making a decision. I am not a financial advisor.