

The Wolf Den Crypto Newsletter - Issue #12

Bitcoin Thoughts And Analysis
Bitcoin went up, clearing a few key hurdles on the way and has managed to stay above them for now. That is decidedly bullish. I remain long from $7,700, as discussed in the previous newsletter. My orders filled on the drop down to "close" the CME gap (which did not entirely happen). Let's dive in and see what the present situation looks like for Bitcoin.
Monthly Chart
Bullish. Last month, price formed a small hammer with a wick below support and follow through on this monthly candle has been tremendous so far. As always, this candle does not close for another couple of weeks, but it bears (no pun intended) watching. Further, if this monthly candle can close above the $9,200 area, it would engulf the previous large down candle from November. That would be a massively positive signal.
Weekly Chart
This remains my favorite timeframe for watching Bitcoin - at no point has it appeared particularly bearish. As you all know, price finally exited the blue trading range that it was stuck in for months. Price wicked down below the range, creating a bullish SFP which signaled the bottom. This was in confluence with the massive bullish divergence with Stoch RSI that I have posted a number of times. The previous two weeks' candles formed a definitively bullish pattern - a dragonfly doji (the blue candle with the small real body and long wick down) followed by a large bullish candle. That large bullish candle was a signal that further price appreciation was likely, especially since it also exited the trading range on this larger time frame.
Note : when price gives a signal on a lower time frame, we look for it to confirm on higher time frames - in this case, 4 hour candles started closing above the range and, even though a few returned to test it as support, the weekly close above sealed the deal.
The largest volume candles on the weekly time frame since the drop last June remain green. This indicates that there is more buying interest than selling interest on significant moves.
Price is currently at the top of the descending channel that we have been watching for months. This is a key resistance.
Daily Chart
Incredibly bullish. Price was rising in an ascending channel and has broken to the top. While ascending channels are "bearish," Bitcoin has a habit of breaking them to the upside and crushing shorts when it is on a bull run.
Price is trading above all relevant EMAs. You can see that it consolidated on the 200 EMA (red) for quite a few days before breaking north and flipping it to support. $8,800 looks key in the near term, with higher prices likely to follow.
The key monthly level that I have drilled into your skulls by now, $7,777 proved to be heavy resistance - the CLEAR flip to support was a great signal.
An important note. Different traders have different definition for what defines a bull or bear market. The most common definition is a series of higher lows and higher highs, reversing the trend of lower highs and lower lows. The last definitive swing high on the chart (for me) since the local top at 14K is the blue line at $10,540. A break above this would be the single most bullish signal we can find.
12 Hour Chart
The are potential bearish divergences forming in overbought territory on multiple time frames, particularly from the 4 hour to 12 hour. We need to keep our eye on these. They do NOT confirm until RSI makes a definitive elbow down, forming a clear lower high. This is the main "bear case" that I am watching.
4 Hour Chart
Same chart, different day. Price clearly exited the blue range and reentered the red range. It targeted the EQ of the red range, dropped to the bottom and tested it perfectly as support and continued up. Text book all around. Now we need to watch what happens at the top of this old range.
Let us not forget the inverse head and shoulders! Analysts move so quickly to new ideas that we often forget the old ones that are still valid. Based on the depth of the pattern, the target is $9,053, which is in confluence with a key resistance.
Hourly Chart


Need I say more? Bitcoin clearly broke resistance and repeatedly tested it as support before blasting off.
Altcoins
Bitcoin is in charge! However, large caps have been moving exceptionally well against USD, and in many cases against Bitcoin as well. This is VERY encouraging, as altcoin runs generally start with large caps and work their way down. That said, I am personally not interested in taking any alt trades that I am not already in at the moment, except adding to my LINK position. I stopped out of ENG even (I moved up my stop loss with the channel) and out of THETA at a small loss.
LINK/BTC
I am still in LINK from 26710 and have added more to my position today. LINK is working hard to recapture a key level on the daily chart (purple). Today's candle looks quite bullish, but there's a lot of time left.
The 4 hour chart shows why I am aggressively buying this coin. Price broke both descending and horizontal resistance and is moving up. This has potential for a major bull move.
Let's take a quick look at large caps alts. You can review last week's analysis here:
BCH/USD
This is presently up 26% since I shared it last week. Incredibly bullish chart - it formed a pennant and broke up with Bitcoin.
EOS/USD
This is up 25% from the entry at the end of last week and has been a great trade for me. It was the first large cap alt to break out, as discussed. Price consolidated perfectly above that local ascending channel and popped up off of the top. Impeccable movement.
ETH/USD
This pair is lagging behind the other majors a bit, but still looks great. As you can see, price broke above the descending channel that represented the long term down trend. Now it's moving convincingly away.
LTC/USD
This was at resistance when I posted it - you can see what happened. It followed other large caps alts for a significant break out - through descending and horizontal resistance.
LTC/BTC
This is really encouraging for Litecoin and for altcoins in general. Price broke back into the old trading range, recapturing a key area of resistance as support. Price should theoretically target the dashed EQ of the range and then the top. Altcoins rarely perform well when Bitcoin is moving up - that's why I find this as a great sign for the entire market.
Crypto Twitter’s Top 10 Content Producers
Crypto Twitter's Top 10 Content Producers + Project Updates
A notable personality in the crypto space, Spencer Noon, ran an interesting poll on Twitter, asking the question below.

I was surprised and flattered to find myself at number 10 on the list. While this is far from a comprehensive study and was limited to the reach of this single tweet (which went a bit viral), I found it encouraging that the community enjoys the content that I work so hard to put out. Thank you to those of you who "voted" and to all of you for continuing to read and support my work. I will continue to churn out content for as long as you are willing to read it!
CME Introduces Options Trading On Bitcoin
The Chicago exchange has announced its highly-anticipated bitcoin options are now open for trading.
Oh boy. Here we go again. The CME has officially launched options trading on BTC, an addition to their strong Bitcoin futures products. Famously, the Bitcoin all time high came within days of the CME futures launch, causing many to speculate that futures, and more specifically the ability of institutional investors to safely short Bitcoin with cash settlement, were the cause of the entire Bitcoin bear market. I do not believe this narrative, as I lean more heavily towards the other obvious signs that the market was due to drop - namely retail fomo, talk of a "new paradigm" and other signals.
It will be very interesting to see the effect that CME options will have on the market, as it allows the bigger players to take bets in various different ways (calls, puts etc.) Options trading on Bitcoin is already available on a number of exchanges - but institutional investors are unlikely to use unregulated exchanges for their trading. Interestingly, BAKKT launched options trading last month with little to no interest.
It's a different story with the CME. As stated in this article, open interest is at a 7 month high on the CME as a result of the options release. This would indicate that big money is intent on speculating on Bitcoin. This is worth keeping an eye on to see if there are any clear signs of it's effect on the underlying price of our believed cryptocurrency.
The Chairman of the CFTC believes that regulated derivates will instill confidence in the crypto market and bring institutional investors to the table. That would be bullish for the space - more money coming in. However, that would not necessarily indicate that price will rise, since they can short.
Accredited Investors In The United States
In the United States, an individual has to be accredited to participate in private investment offerings. These laws are in place to prevent people from making poor investments or over investing in risky companies.
In the United States, to be considered an accredited investor, one must have a net worth of at least $1,000,000, excluding the value of one's primary residence, or have income at least $200,000 each year for the last two years (or $300,000 combined income if married) and have the expectation to make the same amount this year.
In my opinion, this law is antiquated and further serves to separate the haves and have nots in the United States, closing the doors on many potentially profitable investment options to the "bottom 99%." Further, it seems absurd to protect only a portion of the population and not apply the same rules to everyone.
For crypto investors, these laws were the reason that we are unable to participate in token sales, whether ICO, STO or otherwise. It is also largely the reason that we cannot trade on most exchanges, particularly those that offer derivate products. These antiquated laws will continue to be a thorn in the side of crypto investors.
Fear & Greed Index - For The Stock Market

Fear & Greed is CNNMoney's investor sentiment tool that comprises of 7 markets indicators.
EXTREME GREED. The market is on tilt. It is nearly impossible to call or find the top, especially when the FED is artificially propping up the market through repo and quantitative easing and the administration needs a healthy market to win an election.
That said, I am starting to slowly take profit on a number of my positions. I may be very early, but I am starting to feel a slight emotional euphoria (yes, I have emotions too) that I have not experienced since 2017 in crypto. My personal feeling is clearly shared by many, considering the fear and greed index is at 89.
My Favorite Cartoon
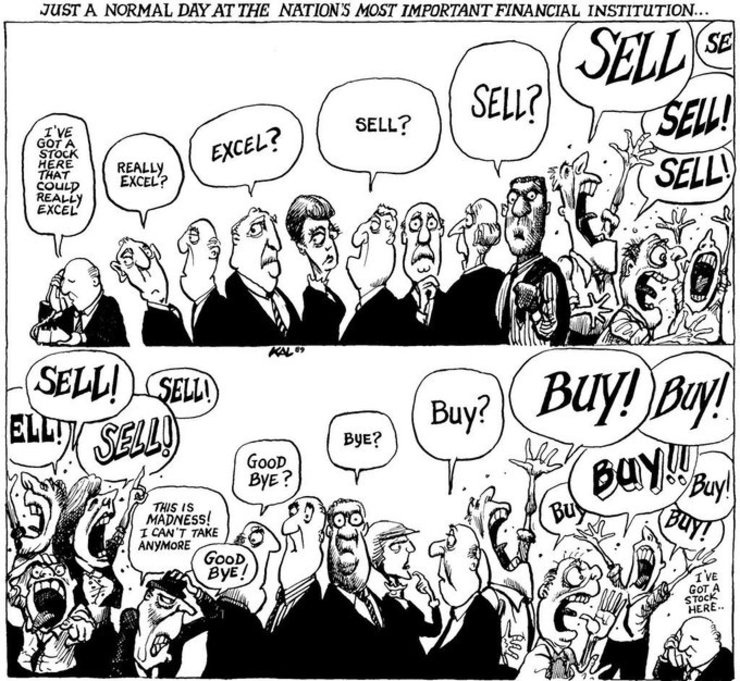
This is Crypto Twitter in a single image. That is all, I just love this cartoon!
Beyond Meat Is Beyond Insane
Insane. 52% profit on Beyond Meat in a few days - not something that happens often in the stock market when you are not trading options. This is the most profitable stock in the past week on Wall Street - we were very lucky we found it. I sold the remainder of the position at the resistance shown, $127. Trade of the year and it's only January 14th! It could keep going, but I am going to run away with my money on this one.
The views and opinions expressed here are solely my own and should in no way be interpreted as financial advice. Every investment and trading move involves risk. You should conduct your own research when making a decision. I am not a financial advisor.