


The Wolf Den #99 - Let Your Winners Run


Bitcoin Thoughts And Analysis
MONTHLY CHART
Same lines, same chart. I really want to see price close above the key purple line that we have discussed endlessly - $10,540. That was the macro higher high that broke the bear trend. The last monthly candle tested it successfully as support - I want to see that happen again here.
DAILY CHART
The daily chart offers a really good look at what's happening. We had the head and shoulders that I shared before (no shown) that almost hit it's target. The red box shows a ton of demand - long wicks down on every candle being bought up quickly. That was a good signal that we had a temporary bottom.
That said, we want to see price above the blue box. It is VERY obvious that is the key area from even a superficial glance at the chart. I would start considering more larger longs if that slips to support again.
This remains the prevailing pattern. A break above the triangle would be bullish, a break below would be bearish at least in the shorter term.
4-HOUR CHART
I opened a fresh Phemex chart on TradingView and drew 4-hour levels. This is the lower time frame chart that I will be watching for now to see where price is likely to bounce or find trouble.
You can see how useful the 4 hour chart is for bullish and bearish divergences. I have shared the historical chart many times, but they are great and consistent signals.
We have a hidden bullish divergence with RSI (pink) that has confirmed. These are much weaker signals than true bull divs, but are a signal of continuation so worth watching. I am not personally trading it.
IntoTheBlock - On-Chain Analysis Of Wrapped Bitcoin (WBTC)
In this report, we bring to you the latest in on-chain cryptocurrency analysis. We look at the blockchain directly and analyze balances, transactions, and the overall activity of market participants. This gives us a unique insight into the future of the market.
This section is written in conjunction with IntoTheBlock (ITB). ITB is an intelligence company that leverages machine learning and advanced statistics to extract intelligent signals tailored to crypto-assets. IntoTheBlock tackles one of the hardest problems in crypto: to provide investors with a view of a crypto asset that goes beyond price and volume data.
The Wolf Den research team uses IntoTheBlock to dig deeper and get the most important insights about the crypto market.
Since Bitcoin cannot be easily moved cross-chain, tokenized versions of Bitcoin are available on the Ethereum blockchain. These ERC-20s are pegged 1:1 to the price of BTC being backed by the equivalent amount of Bitcoin. The first recognized Bitcoin ERC-20 to launch was Wrapped Bitcoin (wBTC), which was released in January 2019.
While there are several tokenized versions of Bitcoin on the Ethereum blockchain, Wrapped Bitcoin (WBTC), remains the largest with a market cap of approximately $971 million at the time of writing. WBTC uses a proof of reserve mechanism which keeps the peg with BTC at 1:1 through the burning and minting of tokens.
Using the IntoTheBlock indicators, we will analyze WBTC from an on-chain perspective.
1. Daily Active Addresses growth have been on a tear throughout 2020
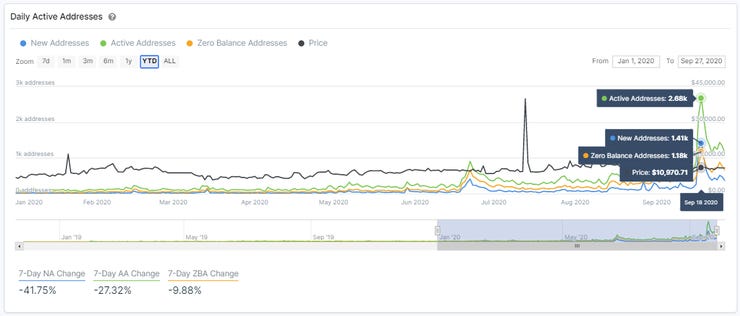
Added incentives have had a clear impact in the number of users leveraging Bitcoin on Ethereum. Throughout 2019 on-chain activity for WBTC remained relatively stagnant as there was a lack of apparent benefits for holders, averaging only 58 daily active addresses.
In 2020, though, Wrapped Bitcoin hit a point of inflection as use cases and ways to profit from holding it increased. First, following the approval of WBTC as a collateral for DAI, daily active users surpassed 300 for the first time. Since then the number of daily active addresses remained at a higher average level moving sideways until mid-June.
As major liquidity mining updates were launched in DeFi throughout June, Wrapped Bitcoin was poised to benefit from this frenzy. This was certainly the case, as daily active addresses jumped by 5x within 5 days following the release of the yield farming partnership between Ren, Curve and Synthetix.
Overall, through the integrations with other DeFi protocols, WBTC has been able to increase the number of daily active addresses to a record of 2680 on September 10.
There are currently 8210 addresses with a balance in WBTC.
2. New Money has been flowing into Wrapped Bitcoin

WBTC Ownership by Time Held Stats
The number of addresses with a holding period of less than 30 days, has increased throughout 2020, reaching on September a high of 4.62k addresses that in aggregate hold 86.11k WBTC.
3. The growth in tokenized Bitcoin has largely been driven by whales and institutional investors

At IntoTheBlock we monitor transactions of over $100,000 of value through our large transactions series of indicators. While data for this indicator for WBTC was close to non-existent throughout 2019 and the first quarter of 2020, it grew remarkably as a result of the integration into other DeFi protocols.
As can be seen in the graph above, large transaction volume went from near zero to over $500 million since June. To be precise, WBTC’s large transaction volume increased by 200x in 6 days following the yield incentives provided to liquidity providers.
The large transaction volume experienced on September 26 was overwhelming at $346 million, but more impressively, when comparing the total transacted volume in WBTC versus the total transacted volume only in Large Transactions ( >$100k/trx ), we can extract that 93% of the total volume belonged to these Large Transactions.
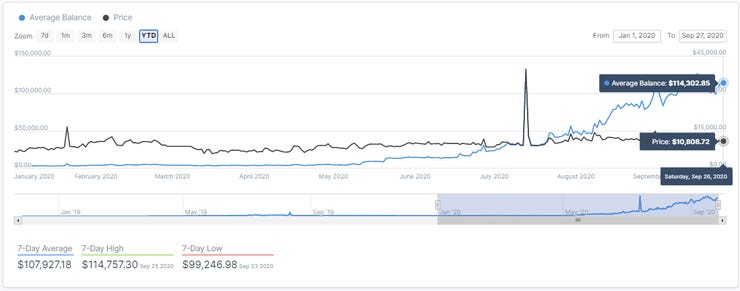
WBTC Large Average Balance Chart
By analyzing key on-chain metrics from IntoTheBlock, we can determine that the growth in tokenized Bitcoin has largely been driven by whales and institutional investors. This is reflected in the average balance of a wBTC holder reaching $114,302.
Altcoin Charts
The altcoin market remains shaky and uninspiring - it is what it is. Dominance has dropped a bit and we have seen a rise in Ethereum, but it's hard to tell if this is just a reactionary bounce or a real reversal. I am only looking at altcoins with shorter term expectations - most go up a bit, don't reach targets and then fall back below entries. I encourage you to lock in those gains when you can and move your stops into profit.
ALGO/BTC
This is an update to a setup that I have been sharing for weeks now. Our last ALGO trade was the inverse head and shoulders shown in the middle, which hit its target at resistance to the sat before dropping.
What we are looking at now is the break out from the large blue descending wedge. That should lead to a nice move up, provided it can break this horizontal resistance at 3165, I have already entered on the retest of the blue line, but the safer entry would be a flip of 3165 from resistance to support. That should send price up to the next set of targets.
I am happy as long as price is above the descending wedge - my idea would be invalidated if price dropped back in. If you take a trade at 3165 as support and price rises, I would personally use a trailing stop to lock in gains.
SNTVT/BTC
As you likely know, I am advisor to Sentivate. It was finally listed on a major exchange, so we can look at the chart. Sentivate was not affected in the KuCoin hack, but it was rough timing for the listing! It did not seem to matter too much.
Price is at a key area here, around 60 sats. This coin is VERY volatile, and before listing basically was moving between 50 and 80 sats in a matter of days. So be careful and size your positions accordingly.
I like it here, it's at the 50% retrace of the move up and a clear area of demand. Price reacted well to that blue zone, putting in a bullish hammer candle, with a long wick through and then a green close on the body. You can use the fibs as support and resistance and decide where to place stops accordingly. I am hoping for a reversal back up from this level, but I have no idea if that will happen.
SUSHI/BTC
I am not likely to trade this personally - I do not like the vibe around the project, the craziness that happened or trading food coins in general. That said, a few people have asked me about it and the setup, from a technical perspective, looks promising.
There has been sustained bullish divergence with oversold RSI on basically every time frame, indicating that buying pressure is increasing while price is dropping. That should usually be good for a move up. The all time low is the purple line, and is an area worth looking for an entry if we see it continue to drop. That said, there is probably a lot of buying interest below that line, because it was the low and there was a huge reaction last time price got there. If you are going to trade it, I would not put a stop too tight - so size your position accordingly. That area I circled is likely a liquidity pool. A break of the blue descending line would be a "safer" entry in this case. Lines can be used as targets, they are resistance.
Legacy Markets
Stock trades from @AltcoinPsycho. You will notice that he is watching some of the same stocks that I have shared setups on before - nice confluence!
UAL (UNITED AIRLINES)
I really like United Airlines. It's regained some strength on the lower time frames, and if you're a longer term investor I think airlines are a very safe trade here. We're still trading almost 3x below covid levels and there are two major catalysts that are inevitable which will pump the stocks hard: Covid rapid swab testing and another stimulus package. Both these catalysts are when and not if in my opinion. I''m targeting $46 for this stock.
I'm a value investor, and I love buying beat up stocks from companies that I know for almost certain will still be around 3-5 years from now. United is one of those companies. There's also talk about United furloughing / cutting some jobs. While this may seem bad, lay offs are typically quite bullish for price action as it's a signal to investors that the company is cutting additional costs.
SPWR (SUNPOWER CORP)
Aside from airlines, solar is another favorite sector of mine right now. Remember, the market is forward looking. Yes, airlines are getting hurt from COVID right now. Yes, the current US administration is not the most solar friendly. With that said, markets are forward looking and I think we will see this reflected in the price soon.
I'm really bullish on the solar industry as a whole, and $SPWR is consistently one of my favorites to trade. It typically has a trending nature to it's price action with predictable pattern breakouts.
We recently just had a nice breakout after some downward consolidation, and I think SPWR is ready to start it's next leg up soon. We've found strong high time frame support which gives me further confidence.
I'm targeting $15 here. This is another excellent stock to hold for long term investors. As long as we hold support (the dotted line), I expect one of the two paths to carry out (the two different colored arrows on the chart)
NIO
The third and final sector I am most bullish on right now is electrical vehicles.
While Tesla and NKLA have been getting all of the hype, NIO has been quietly breaking all time high after all time high. It's currently in a very similar consolidation pattern that we saw right before its last break out.
Many view NIO as a future competitor to Tesla. The Chinese EV company has had a blazing year, with a nice earnings beat in August as well.
This one is another great stock for longer term investors. I think at a minimum, we see NIO hitting $23 in the near future.

Cut The Losers And Let Your Winners Run
“Selling your winners and holding your losers is like cutting the flowers and watering the weeds.” – PETER LYNCH
Investors and traders are often drawn into a strange, seemingly counterintuitive phenomena - letting their losers run while cutting their winners short. This seems strange, but can be explained easily in the context of the emotional side of trading. In an effort to be "right," traders will take profit too early in fear that they will eventually be "wrong" if they let it run. On the flip side, realizing a loss on a trade is also an admission that they were "wrong," therefore compelling a trader to continue losing in an effort to eventually be "right."

We all know what we SHOULD do, right? We should cut the losers early and let the assets that are performing well keep going to continue to pay for those small losses. It's a few huge trades a year that make a trader most of their money. These huge trades can't happen if you cut them short.
What Are NFTs?
"NFT" is the new craze in the crypto space, and for good reason. Personally, I see it as a way to bring my music and art (from my former life) together in a creative and scarce way. I am actually going to be dropping some NFTs based on my music in the coming weeks, which I am very excited about. Since an NFT can really only be about 30 seconds long, I came up with the idea to split one of my popular songs (from Ballin' Oates, which went viral) into 8 different visual art pieces. I will be selling the collection soon - I am really pumped!
You may also have noticed that Pomp and Jason Williams (Morgan Creek Digital) and Ari Paul (Blocktower) are making huge bets on the space. They would not take this lightly if it was not a real investment.
They have other notable use cases - read about them in the quick medium piece linked above!
Cantillon Effect 101
By Sahil Bloom.
With the recent money printing activity and an expanding wealth inequality problem, talk of the "Cantillon Effect" has taken center stage. But what is the Cantillon Effect and how does it work? Here's Cantillon Effect 101!
Richard Cantillon was an Irish-French banker, philosopher, and economist born in the 1680s. His "Essay on the Nature of Commerce in General" is considered a foundational work in the study of the political economy, though it was not published until 1755, well after his death.
While published 265 years ago, the essay has many insights that remain relevant today. He posited that the early recipients of new money entering an economy will enjoy a much higher standard of living than those it trickles down to. The "flow path" of new money matters!
Let's use a simple story to illustrate his point. Imagine you live in a small, simple island society. One morning, you find a package has been delivered to your doorstep from your long lost Uncle FEDerico (who lives in a far away land). The package has $1 million in it.
No one else knows you have received this package. You now secretly have $1 million. So naturally, you start spending it and investing it very quickly. Prices are still low, because no one knows these new dollars exist yet! Your standard of living improves rapidly.
You buy yourself the nicest house, the most beautiful clothes, tons of land, and still have some money left over. But now, people are aware that new money is flowing through the system. Prices begin to rise as supply has yet to "catch up" to the new demand.
So while the money allowed you to invest, spend, and dramatically improve your lifestyle, it did not benefit others in the society in the same way. The sellers of the goods, who received your cash, now face rising prices when they want to consume. The flow path mattered!
This is an ultra-simplified example, but gets at the essence of what the Cantillon Effect describes. Those receiving the new money injected in an economy first are generally much better off than those receiving it via the trickle down. This may lead to inequality.
The Cantillon Effect is often discussed when examining the impact of "money printing" of Central Banks globally. With an injection point of the "new money" at the top, asset owners benefit while the working class may experiencing rising prices for everyday goods like food.
It appears we are seeing some of this today. For example, global food prices rose in August for the 3rd consecutive month, hurting workers. Meanwhile, prices of assets like homes and stocks continued to climb, benefiting asset owners.
Congress is stalling on further fiscal support (designed to be more bottoms-up) and the Fed is weighing further actions. Developing a view on Cantillon's observations on the distributional consequences of the flow path of money is essential for understanding it all.
So that was Cantillon Effect 101. I hope it was a helpful primer on the topic!

Cambridge Crypto Report Reveals Strong Underlying Growth
Over the past three years, the University of Cambridge has released highly detailed annual research reports covering the expansion and development of the crypto markets. Called their Global Cryptoasset Benchmark Study, this 71-page report surveyed 280 of the largest crypto entities covering four main segments: exchanges, payments, custody, and mining. The study claimed that “despite notable headwinds, this year, the industry has entered a growth stage.” I wanted to share two highlights I found in the study.
In section 1 titled “Industry Growth Indicators,” it was noted that, “growth figures reflect the rise of large firms within each industry... which may suggest that a few large players dominate the industry.” In short, this means smaller players have been flushed out by the bear market since 2018, giving strength to larger companies that have survived. It is my advice that investors should extend this observation to the coins they hold and assess their portfolio accordingly. Only the strong will survive, even with a rising tide.
The other notable section in the report was titled “Profiling Crypto Asset Users.” Here it was reported that a whopping 189% increase in crypto users was identified since the last Cambridge report in late 2018. It was around this time Bitcoin’s price bottomed around $3,000-4,000 and has since rallied up to $10,000 and above. It is my understanding that this massive influx of users directly coincides with the upward price movement since Bitcoin’s last major bottom. It is my belief that if interest in the crypto space grows, the price will steadily follow on a macro level.
Grayscale Still Buying Tons Of Bitcoin
GBTC is now worth 4.7B dollars! They have been buying every Bitcoin they can get their hands on. Based on the demand, there is no end in site! Very bullish for crypto.

The Wolf Of All Streets Podcast Ft. Richard Ells
Richard Ells is the CEO of Electroneum, who we can proudly say are the newest sponsors of the show. Richard has years of experience building products and businesses in the tech industry, which has translated into success in crypto, where he is the leader in providing solutions for the unbanked worldwide. Richard has focused on developing a more inclusive financial system through Electroneum, including their own proprietary affordable smartphone and their most recent launch, Anytask.com.
Richard and I further discuss the massive unbanked and underbanked population, trying to pay a Ugandan villager, skipping a layer of technology with crypto, the ICO boom, Amazon, how most cryptocurrencies lack a real-world use case, Anytask.com, longing Gold, Silver and Bitcoin, proof of responsibility, ETN in Brazil, Uganda, India and more.
My Recommended Platforms And Tools
This is where I trade with leverage and can also trade spot with no fees.\
This is where I spend my days teaching and learning! Our Discord group is a one stop shop for everything you need to learn to trade and control your emotions. Feel free to DM me on Twitter or respond to this email for questions.
This is where I invest, commission-free. They now let you earn interest on your Bitcoin held in Voyager, so you can compound while trading. Not only that, you’ll get $25 in free BTC when you download & fund.
Rewards Code: Scott25
I use RoundlyX to buy small amounts of Bitcoin every single day. They automatically round up my credit card purchases (with 10x multiplier) and invest them in crypto. Absolutely brilliant. Passively invest money you don’t need without a thought. Further, they have integrated with Voyager (see above) to offer commission-free purchases.
Rewards Code: WOLF
My preferred crypto tax software.
Binance is finally available in Florida!
Self-Directed IRA for Americans - allows you to invest in Bitcoin and any other asset for your retirement, with all of the tax benefits of a normal IRA.
Concierge Phone Service for Americans that protects your from SIM Swaps and other phone related hacks. I cannot stress enough how amazing this service is.
Follow me on Twitter at @scottmelker. This is where I am constantly updating my trades and sharing ideas.
On-chain and fundamental analysis, research, predictions and indicators, all in one place. Highly recommend.
The views and opinions expressed here are solely my own and should in no way be interpreted as financial advice. Every investment and trading move involves risk. You should conduct your own research when making a decision. I am not a financial advisor.