


The Wolf Den #97 - Everything You Need To Trade And Invest!


Bitcoin Thoughts And Analysis
Bitcoin has continued to correct, making a lot of traders and investors question whether the recent bull market is over or never existed in the first place.
In my opinion, we continue to see very healthy retracement. There is no need for panic. Price has to go down to go up - otherwise every chart would just be a straight line!
I am currently long Bitcoin once again, with a cost basis around the current price of $10,430. I like the R/R of a trade here, but that does not mean that I am feeling particularly sure that price has bottomed. As I always say, I often take trades that have a good risk/reward, even if I think they could fail. I think there is more upside than downside with a tight stop.
Let's take a look at each time frame
MONTHLY CHART
Simple - we want to see the monthly candle close above the key level at $10,540. That was the line that, when broken, represented a higher high on the chart and broke the "bear market" that price was in from the 14ks. Key levels are marked, use them as you see fit.
You can see that the macro downtrend was broken a couple of months ago, so nothing is particularly bearish here on this time frame.
WEEKLY CHART
This is just an idea, as the weekly candle just began and you cannot reliably draw a pattern on a candle that is not closed. That said, price appears to be forming a bull pennant. If that ascending support is false and price goes lower, we could see it turn into a descending channel or flag.
Some would view it more as a symmetrical triangle, since the flag pole is not that defined. This would be a more neutral pattern and traders would wait for a break to either side to determine the future path.
I have shared these Fibonacci levels a few times. We caught the bottom of this entire move on the tweezer bottom candles over the past few weeks, with the move up to $11,100 where price predictably found resistance at the black line and dropped. The red fibs show that we had over 70% retracement of the last move up, which is plenty! That is considered a very healthy and large retrace, so there's no reason based on that move to believe we need to go lower.
The larger set of fibs on the right, showing the move from March 12th to the top, has not retraced nearly as much. That would be an argument for a bigger drop. Even a drop to $7,100 would only be a healthy 61.8% retrace. Keep that in mind when looking at the bigger picture. On large time frames, price is bullish!
DAILY CHART
You can get a better look at the triangle on the weekly by zooming into the daily. You can also see that price is sitting at a key level here, $10,428. Holding this area should send it up to the next line around $11,100. You can see that we had a head and shoulders break down that almost hit its target - definitely close enough to consider it played out. So the downside from that pattern is finished.
My more immediate concern here is that we saw a reactionary bounce from the drop that retraced almost perfectly to 50%. If you have been following me a while, you know that almost ANY large move will retrace 50%. That is usually the top of a bear flag if one forms as well, because further retracement beyond 50% really invalidates a flag. So we could just have a reactionary bounce here before further movement down.
If you are trading this, it's really a matter of taking the breakout long of the top descending line or a short of a breakdown from the lower ascending line.
4-Hour Chart
This is why I am currently long. 4 hour overbought and oversold divs have historically been tops and bottom on Bitcoin moves. Very reliable indicator that has not failed too often, so it has a very high hit rate. As you can see, RSI went from an oversold bull div to an overbought bear div and back to an oversold bull div. Clear tops and bottoms each time, which you can see going back YEARS on the 4-hour chart. Further, each time price hits overbought, you expect a trip to oversold and vice versa. We have now made that trip back down. Even if we fall again, we will likely make a bigger bull div, although that is not guaranteed.
Also, we have to watch for a potential hidden bear div here, which would weaken the idea. We really want to see a 4 hour candle close above $10,503 or so, sooner than later.
If price drops, I will be looking for bigger bull divs, further into oversold territory.
It should be noted that FUNDING IS NEGATIVE and predicted to go MORE NEGATIVE in the coming hours. That means that shorts are paying longs, usually a sign that a squeeze is possible or that price will at least rise for a bit.
On-Chain Analysis Of Ethereum Profitability From IntoTheBlock
To sign up for insights from IntoTheBlock, use this link and code wolfden01.
Over 75% of addresses are profiting on their ETH positions

IntoTheBlock’s Ethereum's Historical In/Out of the Money (HIOM) indicator analyzes investors’ on-chain positions based on addresses’ average cost for a token, in this case ETH. Based on this, the HIOM calculates the percentage and the total number of addresses that are “in the money”, or profiting on their positions on paper. By comparing variations in the HIOM over time, we can determine buying/selling activity based on the number of addresses profiting at a specific price level.
At the current price of $347.68, 62.09% of the addresses currently holding ETH are reportedly profitable. If we compare the price of ether to July of 2019, back when the price was above $300, 13.5 million addresses (less than 50% of all holders) were in the money. Comparing these numbers to the ones observed as ETH surpassed the $300 barrier in July 2020, we see that the number of ETH holders profiting at a price of $310 has more than doubled.
In spite of the recent price drop in Ethereum, the majority of addresses are in profit, this massive increase throuoguht 2020 signals that millions of new addresses bought ETH below $300. Additionally, since the growth in addresses profiting is greater than the increase in the total number of ETH addresses with a balance, we can establish that approximately 1 million previous ETH holders opted to bring their average cost down.
Breaking $389 for Ethereum is Going to Require Some Defi-Push
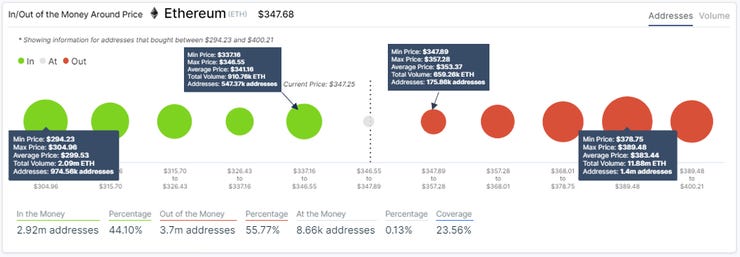
Intotheblock’s In-Out Money Around the Current Price(IOMAP) uses machine learning to identify the ten most relevant clusters of investor positions at a range of plus-minus 15 percent of the current price.
The IOMAP indicator reveals that the most crucial resistance level sits at that $383.44. Roughly 1.4 million addresses previously purchased 11.88 million ETH at the range between $381.43 and 392.16, a critical resistance level. This could mean that Ethereum might be hovering around $380 for some time.
Looking at the levels of support, over 900 thousand addresses had previously purchased a total of 2.09 million ETH between $294 and 304. This is expected to act as support as holders in this range will attempt to remain profitable on their positions and push prices above this level.
Additional Insight: With the launch of Uniswap's token UNI, Ethereum network activity reached a new ATH

Ethereum’s outstanding network growth evidence the high demand to use ETH and the thriving DeFi ecosystem built on top of it. On-chain activity showcases the widespread adoption and development of the Ethereum blockchain.
The number of transactions has been on a consistent uptrend throughout 2020. On September 17, the same day the UNI token was launched, the number of transactions on the Ethereum network reached its highest level ever with 1.32 million.
This growth in transactions highlights the increased demand to use the Ethereum blockchain, pointing to ETH’s utility value as infrastructure for a decentralized economy being significantly stronger than a year ago.
Altcoin Charts
The alt market has been very shaky for weeks now, which is why I have shared almost no trades. As you know by now, I only share trades that I am watching myself and I only trade when the market conditions are ideal. I have received quite a bit of push back from subscribers about not providing enough altcoins charts, but the reality is that I am trying to SAVE THEM MONEY by not forcing trades into a market that is correcting. Remember, no position is a position. Deciding to sit on the sidelines and wait for more clarity is a choice, like any trade - and one that can help you preserve capital. Alts have not looked good, and alts still do not look great.
If Bitcoin drops here, alts are likely to go red across the board! There's a real risk of that happening, so be VERY CAREFUL TRADING ALTS, IF YOU CHOOSE TO DO SO AT ALL.
That said, I have started to take some SMALL positions in altcoins, both on the long and short side. More importantly, I will share larger setups and the areas that I WOULD take a trade. This is how I like to share ideas, because it gives you time to consider the chart, set alarms, and watch to see what happens. I am not here to say "buy or sell this now." My goal is to show you what I am watching so that you can use the information within your own system and trade as you see fit.
Many setups will never even trigger, which is fine!
Let's first take a look at Bitcoin Dominance.
BITCOIN DOMINANCE
I have been tracking this chart closely for months, updating with every single breakdown and retest as resistance. It has followed TA perfectly until recently. When it drops, alts tend to do well. Very simple.
For the first time we see some signals that the bottom may be in - that would be bad for alts in general. You can see that it broke the descending blue line, a resistance that we have been watching here for a while. That's not great, but also is not the end of the world. As you can see, it has once again been rejected at the purple line, with wicks above and closes below. That is the area I am watching now to see what is likely going to happen with alt coins. Rejection here could give us another little window to trade alts, which look like they could have some local bottoms forming.
ALGO/BTC
I bought ALGO at 2700 when I noticed this oversold bullish divergence with RSI on the 4-hour chart this morning. Again, I took a small position, because I am not feeling particularly great about alts. I will close if it makes a lower low than the recent one and look for a better entry, like the line below at 2455.
On a macro level, the real entry I am looking for is a breakout from the blue descending wedge. That would signal a likely move to the top of the blue line, a massive gain.
My targets for this current trade are 3165 and the descending blue line. I will reevaluate if price makes it there.
You can also see the last ALGO trade, the inverse head and shoulders in the middle of the pattern. This hit the target almost to the exact sat, as you know if you are a subscriber. This was a perfect touch of the descending and horizontal resistance, right at the top of the measured move target from the inverse head and shoulders. That's why we take profit and do NOT get greedy. If your trade's target hits, you take profit!
LINK/USD
I shorted the LINK/USD pair this morning on Phemex. I rarely short altcoins, and I rarely trade USD pairs, but I had an old alarm set on the ascending red line that went off yesterday. I decided to take a shot at a short on this pair on the retest of that line as resistance, which was a perfect entry so far. This was in perfect confluence with the horizontal line at 9.162, which broke down as support and was also tested as resistance. This is a small trade, and VERY easy to let go if I am wrong, because the idea will be invalidated with a break back above the red line or 9.162 with a candle close. Targets are the pink lines, although I have a funny feeling that we won't get there. Since this is a USD pair, it will likely follow BTC - which I am ironically long at the moment. This is somewhat of a hedge against that position.
Remember, taking a trade is not about being right! It's about assuming you are wrong and making sure that you lose as little as possible when that happens. I am not particularly bearish on LINK, I just like the setup with a tight stop and a clear invalidation.
UNI/BTC
UNI is the talk of the community, since it was a free airdrop to anyone trading on Uniswap. I have held on to my coins, as I view them as a free lottery ticket.
Price has been dropping somewhat aggressively, but there is hope that it could be bottoming. Price is in a clear descending wedge, which statistically should break to the upside and eventually target the top of the pattern. Price is also sitting on a key support at the red line, 36599. In addition to this support, there is oversold bullish divergence with RSI.
Since there is s limited price history, this is an hourly chart. Hourly divs and patterns are NOT as strong as larger time frames.
Fibonacci levels can be. used as targets if this does breakout. You can see how well they line up with the previous price action. If you were to draw lines yourself, they would be right at the fibs. Incredible how that works, right?
YFII/BTC
This saw a sustained downtrend after being listed on Binance, after the initial listing pump. That trend broke and we saw a nice move up. That entire move has been retraced back down. That said, we have a bullish SFP (swing failure pattern) below the recent low, which indicates that liquidity was found and there is buying interest in that area. That's a potential bottom signal. The trade here is a break of the descending black line, which I have set an alarm on. That would signal an end of the downtrend and that price is likely to continue back up.
We also have bullish divergence with oversold RSI, like many alts at the moment. This seems a likely moment for a relief bounce for a lot of coins across the board, if Bitcoin can remain somewhat stable.
YFL/USDC

This chart is from uniswap.vision, so it does not have my normal colors and is not interactive. You cannot make it your own.
I shared this idea on twitter the other day, with the bull pennant that included the ascending line. I said that those often break down to become bull flags, which is not the case here yet. The trigger on a trade here would truly be a break of the descending line.
That said, we have confirmed bullish divergence on the hourly, and it looks likely here on the 4 hour chart as well. Also, we presently have a bullish SFP (swing failure pattern) confirmed on the previous candle, and possible on this candle. If this candle closes above that horizontal line at $310.977, there is a good chance that this will rise. That would indicate that liquidity was found below that previous swing low.
This is a knife catch for the moment. Further, if it does rise and get rejected at the descending line, we will likely have a descending triangle pattern. Those are viewed as bearish, wrongfully, because they actually break up 63% of the time when they are in an uptrend like this. They serve best as a continuation pattern.
There are NO STOP LOSSES on Uniswap, so I keep my positions small enough that this can literally go to 0 and I will only lose 2% of my portfolio.
Legacy Markets
As I mentioned in the intro, I have invited my friend Altcoin Psycho (follow him on Twitter) to contribute trades and analysis on the stock market moving forward. This will be in addition to my own ideas and trades.
If you are a paid member, you know that I have not shared many stock trades in the past few weeks - as I have said a number of times, the market is at a bit of an inflection point, and looked ready to correct a bit. That did happen, and many stock have suffered. AP's analysis on the market lines up with my own ideas - that the environment right now in the market is not ideal for trading, but it could be once again soon. Here are his thoughts on SPY.
SPY
Hey everyone, before I deep dive on any specific assets, I'd like to start with a macro level overview of the stock market. I like using the SPY for this.

As you can see in the above chart, the SPY is at a VERY significant zone. The green box you see is the yearly open. Any time price has failed to hold it, we've dumped violently. And when we do hold it, we rally hard.
My suggestion for this week is going to be a simple one: do not enter any new trades until we can confirm this support level from the yearly open is holding. With that said, I also do not recommend panic selling your existing stocks / options at this level, as we are likely at or near a bottom.
With the November election coming up, Trump knows that the market will be a heavily discussed matter. A strong stock market will give him some talking points going into the debates, whereas a weak market will be a very great threat to his re-election bids. The incumbent wins roughly 87% of the time when the market is doing well, so I expect him to do everything he can to keep the market propped up.
This is why I suggest for now just waiting for a more clear set up from the SPY and not panic selling at this point.
If this yearly open support does fail, I'm expecting us to fall to the 300-310 level. This will be my first level of interest for a major bounce. I will be sure to let everyone know what blood I am buying if we do see a major dip. While big dips can be scary, remember that it simply means you get to buy your favorite long term investments at a good discount.
As always - none of the above is investment advice. It is simply my own plan.
If you enjoyed this analysis, please give me a follow @altcoinpsycho on twitter, and feel free to say hi. My DMs are always open for questions. Now back to Scott's analysis...
DXY (USD INDEX)
The month is not closed yet, so we will be watching the current candle closely, as we have been for weeks. The macro channel from the great recession broke down last month in spectacular fashion. As I mentioned a number of times, we fully expected to see it rise to test former support as resistance. A support that strong "should" be retested as resistance before the bigger move down. Also as discussed a number of times, this temporary move up for the retest would likely negatively impact the price of Bitcoin. I view the two as inversely correlated, as you can see in the chart below.
If DXY is ultimately rejected here, I would expect Bitcoin (and all other assets) to rise. Remember, the government wants a strong stock market and a weak dollar.
Also consider that this is a monthly chart. This candle could easily close above and then fall below in the next month or two. This is a slow moving analysis.

Sögur Token - What Money Should Be
I had the opportunity to interview Ido Sade Man on The Wolf Of All Streets Podcast, which drove me to dig more deeply into Sögur and their team's innovative approach to monetary policy. What I have found is a novel and brilliant approach to a new form of money - taking the good ideas from Central Banks and eliminating their bad practices. The best way I can personally describe it is a perfect mix of the best parts of Bitcoin and stablecoins, with an all star team of monetary policy and technology experts and a governance model that guarantees decisions are made by the holders and not a centralized authority - even their own team. Here's more info.
What is SGR?
SGR by Sögur - previously known as Saga - is a digital coin built to provide a self-sustaining, democratic and global currency. It is modeled to incorporate the volatility crypto markets seek, while also using stabilization mechanisms to temper volatility risk when market conditions are fast-changing and unpredictable.
SGR’s unique features:
A bonding curve protocol exposes SGR holders to carefully modeled volatility - using stabilization mechanisms to temper risk in fast-changing and unpredictable market conditions, while creating an opportunity for sustainable intrinsic value growth.
A model where early adoption is incentivized as the ecosystem grows, thanks to the bonding curve model.

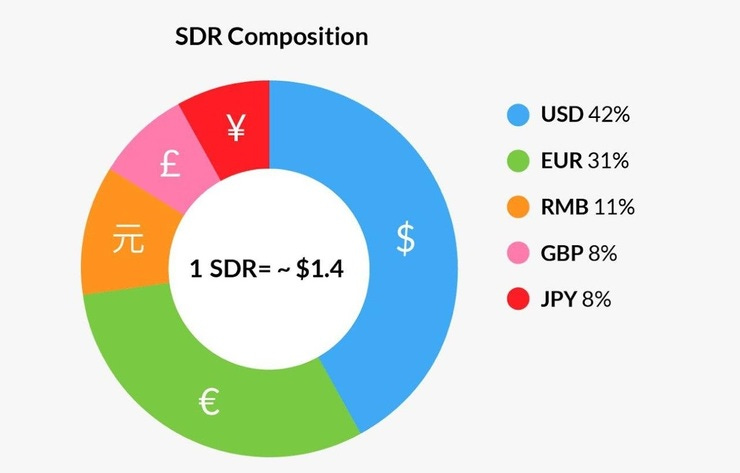
SGR is backed by a reserve configured to match the IMF’s basket of currencies. Funds are kept in a variable reserve composed of world-leading fiat currencies held in reputable banks. The reserve ensures holders can always sell and redeem SGR. As such, the contract will always offer to buy back SGR, drawing on funds from the reserve.
A democratic governance model built on the premise that the SGR project belongs to the currency holders, allowing holders to vote and partake in decision making as well as elect the leadership of Sögur.
A team of experienced entrepreneurs, financial professionals, technology experts, economists and academic researchers, all working towards delivering a truly democratic, global, digital currency.
Advanced reading:
https://www.sogur.com/monetary
https://www.sogur.com/blog/blogPost/XRHt3hIAACMAoQsw/
https://www.sogur.com/blog/blogPost/XRs7BBEAACIAzbB6/
I have done a deep dive into these articles and more and find their approach to be brilliant and compelling, driven by a team of world famous economists and monetary policy experts. Check it out!

Your Biases Are Keeping You Poor
Written by my mentor Christopher Inks. You can join his Discord and trading course, which is where I hang out daily and chat with traders, for 50% off the first month. https://howtotradetowin.com/?coupon-code=WolfsDen50%off
Your biggest enemy in the markets is not Wall Street, or whales, or even the multitude of successful traders out there – it is you. Plain and simple. Most retail traders spend all of their time jumping from system to system, exerting little effort to actually understand and apply them properly and consistently, rather than work on the one thing that will have a greater impact on their trading than anything else. I am talking about their biases. These include overconfidence, confirmation, anchoring, and loss aversion.
Overconfidence Bias – thinking you know everything you need to know or can learn it overnight. This is a problem because it tends to lead to overtrading. Worse yet, it can result in a trader taking too large of a trade with the belief that it will make them significantly wealthier. The reality is that the trader most often trades in and out of their trades until there is no profit left, and that is only if they took a positive trade. More times than not they will end up losing money because the trade was not worth taking in the first place.
Confirmation Bias – only paying attention to, or purposefully seeking out, the information that supports the beliefs you currently hold. Unfortunately, this leaves you vulnerable to missing the big, red warning signs that things are not going the way you believed they would. In missing those signs, traders end up losing money repeatedly as they find themselves fighting the market’s trend.
Anchoring Bias – this is the kiss of death for trend traders. It is the belief that the future will continue to look like the present. In other words, they fail to recognize that a trend is coming to an end. So, they continue to buy a declining price or sell a rising price causing them to add to their losses with each trade. Recently, we have seen this in the stock market, gold, and silver, as well as the dollar.
Loss Aversion Bias – this is one I love to discuss because traders have the most difficulty overcoming it. This refers to the idea that pain is felt greater than greed. As such, traders are reluctant to cut lose a losing trade. So, they end up holding on to it and turning a short-term loss into a much larger, longer-term loss that can decimate their portfolio.
Now that you know what they are, how do you overcome them? The truth is, it is always easier said than done. But it can be done. To do so, you must, first, be honest with yourself – acknowledge that you are doing it. Only after you do so can you take the steps required to overcome your biases.
After you have been truthful with yourself about your biases, you should start by establishing a risk management plan. You need to keep your losses at 1% or less of your portfolio. By adhering to this, you will be forced to plan out your stop loss and exit BEFORE you enter your trade. This means no mental stop losses as they most often lead to a person ignoring the mental stop loss and, instead, emotionally rationalizing why they should not exit the trade at that point. Remember, nothing done emotionally in the market turns out positive on a consistent basis. Also, when planning your trade, make sure you are looking at multiple time frames. Traders often just stare at the 15-minute of 1-hour charts that they are attempting to trade, oblivious to the overall trend and impending warning signs that the trend may be nearing an end. By paying attention to the larger, and smaller, time frames as well traders are better able to prepare themselves for the possibility of a reversal. And being aware of a possible reversal means that traders will be less likely to hold onto the position as price moves against them thereby locking in greater profit or reducing their loss.
Want to know more about how to effectively deal with your biases and turn your trading into a consistently profitable venture rather than continuing to rack up losses? While you are at it, every Wednesday you can join in on our live training and learn all the little tips, tricks, and techniques that can make you profitable from day one, without any previous market experience, while you’re learning how and why the markets move like they do. I have put together a special deal for readers of this newsletter as a favor to Scott. You can receive 50% off your first month of Tier 3 access at TexasWest Capital, the industry’s leading trader education and market forecasting service. Follow this link: https://howtotradetowin.com/?coupon-code=WolfsDen50%off and then purchase 1 month of Tier 3 access. The discount will be applied automatically.
This coupon code is only valid for new members. If you were a previous member of TWC and would like to join again, please send me an email directly at christopher.inks@texaswestcapital.com and I will be happy to send you the same discount as well.
Trade Management Case Study - Bitcoin
This is a breakdown of my most recent Bitcoin long, which I shared both here and on Twitter in real time.
As we all know, Bitcoin saw a sizable drop from above $12,000 to below $10,000 a few weeks ago. I was a bit concerned when Bitcoin lost the $10,540 area, but was still looking for longs as my contention was that Bitcoin remained in a bull trend.
I started to pay quite a bit of attention when Bitcoin finally reached oversold RSI on the 4 hour and started to form a bullish divergence. I took my first and largest entry (a few buy orders) with an average of around $9,900 when it looked highly likely that the bullish divergence would confirm, which it did just hours later, when I also added a bit more.
At this point, I placed my stop loss at $9,774, below the previous swing low at the bottom of the bullish divergence, with a bit of room for a slightly lower low to happen on a wick in the middle of a candle. This area was never visited again.
I added to the position higher on September 9th when the daily bullish divergence looked likely to confirm from the price bottom on the 8th. This was a smaller position at $10,100, which brought cost basis up a bit. I did not choose to move my stop loss here, as I was confident we had reached a bottom and did not want to get stopped out on a crazy candle or liquidity grab.
I have NO PROBLEM adding to a position at a higher price as I see further confirmation of bullish action. Buying higher on confirmation is actually a btter entry.
Price then broke the descending resistance, and I added once more on the retest of that black descending line as support, at around $10,220. This brought my cost basis up a bit further to $9,981. The latter additions to the trade were much smaller than the positions I took near the bottom.
At this point, I moved my stop up to below the last entry, locking in all of the profit on the trade from below, guaranteeing I did not take a loss.
The only major "thinking" I had to do on this trade was to decide what to do at $10,540, the macro resistance. My assumption, based on the 4 hour and daily divs (and every time frame in between) is that there was more upside to be had. I was almost wrong! Price was rejected and almost came back down to hit my stops. Price ended up making a slightly higher low above my stop and continuing up.
My first take profit was $10,791, based on the resistance shown. I took 50% off the table here, and moved my stops up below that line once it broke and a candle closed above. I soon stopped out - I clearly made the stop a bit too tight. This gave me an average exit of roughly $10,755.
I "missed" the rest of the move up, and price ultimately hit my main target of $11,107. Moving my stop up further could be viewed as a poor move in retrospect, but I am happy with the way the trade was managed.
Compounding 101
By Sahil Bloom:
Compounding 101 Albert Einstein famously said, "Compound interest is the eighth wonder of the world. He who understands it, earns it; he who doesn't, pays it." But what is this great wonder and how does it work? Here's Compounding 101!
First, some quick definitions. Simple interest is interest that is paid only on the initial principal balance. Compound interest is interest that is paid on the initial principal balance plus the accumulated interest from prior periods. You earn interest on your interest!
Let's use a simple story to illustrate the incredible power of compound interest. Imagine you work for a tech company that was just acquired by Google. You cash out your stock options and receive a windfall of $1 million. Your colleague Paul is in the same situation.
Paul sees the 10% rate from Simple Bank and opens an account, depositing his $1 million. You, on the other hand, have read the Einstein quote on compound interest, and decide to open an account at Compound Bank. You're in this for the long-run. So what happens next?
Paul's 10% simple interest will earn him $100K every year (10% on $1m principal). Your 8% compound interest will earn you $80K the 1st year (8% on $1m principal), $86K the 2nd year (8% on $1.08m), etc. You earn more interest every year. Paul earns the same amount.
After 1 year, Paul has $1.1 million and you have just $1.08 million. He gloats about his financial prowess. "Just wait," you tell him confidently. By year 7, you have leapfrogged Paul. By year 20, he has $3 million to your $4.7. By year 30, he has $4 million to your $10!
"You should have listened to my guy Albert," you tell him over the phone from the library in your mansion. The key here is that with compound interest, you receive the rate of return on both the principal and the accumulated interest. It creates a snowball effect, of sorts.
The same concept applies to stock markets, as the returns of this year compound upon the returns from last year. Historically, putting money in a market index fund and allowing it to compound (reinvesting dividends) was the simplest, best way to build long-term wealth.
I'm all for keeping things simple, except when it comes to interest. Trust Einstein. Whether with savings, investments, or knowledge, let it compound!
So that was Compounding 101! I hope you found it useful.
Trading Quotes To Live By
I constantly look to the wisdom of experts who came before me to learn lessons. Here are just a few of my favorite quotes about money and trading.
“Trade money for time, not time for money. You’re going to run out of time first.” Naval Ravikant
“The rich invest in time, the poor invest in money.” Warren Buffett
“The money you have gives you freedom; the money you pursue enslaves you.” Jean-Jacques Rousseau
“My favorite things in life don’t cost any money. It’s really clear that the most precious resource we all have is time.” Steve Jobs
“The men on the trading floor may not have been to school, but they have Ph.D.’s in man’s ignorance.” Michael Lewis
“The expectation that you bring with you in trading is often the greatest obstacle you will encounter.” Yvan Byeajee
“The market can stay irrational longer than you can stay solvent.” John Maynard Keynes

MicroStrategy Owns .18% Of BTC That Will Ever Exist
Everyone in the crypto community knows by now that Michael Saylor, CEO if MicroStrategy has made a HUGE bet on Bitcoin, moving their cash reserves into the cryptocurrency as a hedge against central bank monetary policy and inflation. They now own .18% of the BTC that will ever exist. HE explains fully why he made this choice in the article above.
Also, if you are wondering what the process for buying almost 17,000 Bitcoin looks like, below is the process in Saylor's words.

“The MicroStrategy Effect” - Liquor Stores And Bakeries Catching On
MicroStrategy set a new financial trend with its $250 million initial Bitcoin investment and subsequent BTC purchases. Unchained Capital noticed this purchasing trend and the resulting complications companies face with massive Bitcoin purchases, so they set out to assist companies that wish to follow the MS Strategy. Unchained Capital revealed that businesses you wouldn't expect are following suit like “local liquor stores and local bakeries,” far different from MicroStrategy, a billion-dollar business involved in cloud computing. It is hard to miss the fact that retail is catching on quickly.
FinCEN Files Reveal The Ugly And Obvious Truth Of Legacy Banking
A BuzzFeed research initiative has threatened to leak FinCEN (Financial Crimes Enforcement Network) government files that expose just how bad the legacy banking system can be. It was discovered that trillions of dollars since 1999 have been moved around the world, unimpeded by the banks knowingly transacting this dirty money. Rather than stopping the suspicious activity, banks continued to move the money for their own benefit, collecting fees and profiting from the activity. Some of the banks included in the leak are JPMorgan, HSBC, Standard Chartered, Bank of America, and more. The leaks revealed the banks’ links to terrorist organizations, known Ponzi schemes, and public corruption scandals, all of which were knowingly facilitated and ignored.
A quick trip to the FinCEN home page reveals that their only concern is threatening any entity that intends to make public these files. So the next time someone mentions that Bitcoin is used for illegal purposes, just let them know that our own banks and U.S. dollar facilitate crime at roughly 10 times the scale - and nobody seems to care.

The Wolf Of All Streets Podcast Ft. Jeff Booth
Jeff Booth is the author of The Price of Tomorrow - Why Deflation is Key to an Abundant Future. After extensive experience developing cutting edge technology, Jeff began to observe that the deflationary course of ionnovation is at odds with our inflationary fiscal policy. Concerned about the course of the dollar and markets, Jeff offered numerous solutions to our government's mistakes - buy Bitcoin, hold cash, and invest in tech stocks. Both his book and this conversation offer valuable insight into a crisis that neither the rich nor the poor can avoid.
Jeff Booth and I further discuss working at the forefront of tech, hidden taxes, a Ponzi scheme of debt, the government propping up the market, Bitcoin as our life raft, the rich moving into missile silos, a non-existent middle class, time as our most valuable resource, creating generational wealth, going irresponsibly long on Bitcoin, overpriced real estate, inflation vs. deflation, tech monopolies, Bitcoin to $0 or $1,000,000 and more.
Sponsored by:
RoundlyX (Code WOLF when you sign up), Equos and Celsius (Code WOLF when you sign up)

Phemex On TradingView!
It is no secret that I do my leverage trading exclusively on Phemex. They continue to innovate and improve and have never given me a single reason to doubt their platform. There are a few huge things that have happened of late that are worth noting:
TradingView Integration: Users can now chart Phemex’s trading pairs on the TradingView platform. To do so, simply visit https://www.tradingview.com, search for PHEMEX: charts.
7 New Contract Trading Pairs Listed: You can now contract trade ADA, BCH, COMP, LEND, YFI, ALGO, DOT with up to 20x leverage on our exchange. Find new coins on the Contract Trading page.
The Phemex Trader's Arena: Very soon the best traders will have a chance to compete for up to 100 BTC in the team and individual prizes! We are proudly announcing the first trading competition which will take off on Phemex on October 24, 2020, and inviting our KOLs to lead their own teams! The registration for team leaders starts on September 24. Welcome to build your team and compete for the best trader title! Awaken your inner trader, are you the one? Stay tuned, more details will be shared on Phemex soon.
You should absolutely sign up and get some free BTC to trade with. You can DO THAT HERE.
My Recommended Platforms And Tools
This is where I trade with leverage and can also trade spot with no fees.\
This is where I spend my days teaching and learning! Our Discord group is a one stop shop for everything you need to learn to trade and control your emotions. Feel free to DM me on Twitter or respond to this email for questions.
This is where I invest, commission-free. They now let you earn interest on your Bitcoin held in Voyager, so you can compound while trading. Not only that, you’ll get $25 in free BTC when you download & fund.
Rewards Code: Scott25
I use RoundlyX to buy small amounts of Bitcoin every single day. They automatically round up my credit card purchases (with 10x multiplier) and invest them in crypto. Absolutely brilliant. Passively invest money you don’t need without a thought. Further, they have integrated with Voyager (see above) to offer commission-free purchases.
Rewards Code: WOLF
My preferred crypto tax software.
Binance is finally available in Florida!
Self-Directed IRA for Americans - allows you to invest in Bitcoin and any other asset for your retirement, with all of the tax benefits of a normal IRA.
Concierge Phone Service for Americans that protects your from SIM Swaps and other phone related hacks. I cannot stress enough how amazing this service is.
Follow me on Twitter at @scottmelker. This is where I am constantly updating my trades and sharing ideas.
On-chain and fundamental analysis, research, predictions and indicators, all in one place. Highly recommend.
The views and opinions expressed here are solely my own and should in no way be interpreted as financial advice. Every investment and trading move involves risk. You should conduct your own research when making a decision. I am not a financial advisor.