


The Wolf Den #96 - Why Do Options Exist?


Bitcoin Thoughts And Analysis
I am presently flat on Bitcoin trades, having closed my long a bit "early" at $10,850. Price continued up a bit from there and has since dropped back down. I considered a short at $11,100, but was not near the computer and chose not to take that. It would have been a nice trade.
WEEKLY CHART
You can see the confluence of resistance around $11,100, with a clear horizontal level and the 38.2% fib both lining up in that spot. That's why I considered a short in that area, which would have been a nice scalp. Still, nothing bearish about this weekly candle and structure so far, so shorting is generally ill advised. For deeper analysis, nothing has really changed since Tuesday - you can revisit there.
4-HOUR CHART
Zooming into the 4 hour gives us a clearer picture of that perfect rejection at $11,100. I want to see price above that now to indicate continuation is likely. I remain very bullish above $10,540 on higher time frames, for reasons I have laid out countless times.
I shared this ascending channel on Tuesday - you can see that price was rejected at the top and has now tested the EQ (equilibrium, center dashed line) as support. It would be great to see it hold the top half of this channel and continue up.
If the channel breaks down, we would expect price to likely visit the recent lows once again, but we will cross that bridge if we come to it.
For now, things continue to look generally bullish. Even a breakdown is no big deal on any higher time frame.
Altcoins
Altcoins still look very shaky, with many sitting on support but showing very little bounce or reaction. This is a key time, but not a great moment to start trying to catch falling knives. I will share trades as soon as the market looks more stable. I am trying to save you money by encouraging you sit on the sidelines for now until we see some clearer confirmation of reversals. Otherwise, we are just gambling. That could pay off if this is the bottom, but it's not my approach.
BTC DOMINANCE
I posted this chart on twitter yesterday, eliminating the noise and focusing solely on the blue line. As you can see, dominance was rejected, which is encouraging for alts in theory. The issue is that it came with a small drop in BTC price and alts did not really move - this can be more of a sign of money exiting the market than of money flowing directly into alt coins. For now, I would say we can be cautiously optimistic and hope that dominance continues to drop for the sake of our alt coins.
DOT/BTC
This looks a bit better than most pairs. Recaptured the trading range and is currently holding it as support. Locally I would like to see that little black line broken. But anything in the blue zone is encouraging. A break below blue would be an easy place to take a small loss and continue on with your life.
Watch for a break of the descending black line!
Reminder, alts are risky right now. I cannot endorse any trades at this moment, just share the chart and you can act as you see fit.

The Power Of Dollar Cost Averaging
This is a great article that shows in simple terms how profitable it would have been to dollar cost average into bitcoin on a weekly basis in 2020. Keep in mind that there have been huge dips this year, including a precipitous drop to below $4000, a price that dollar cost averagers would have likely missed due to the quickness with which Bitcoin bounced back to $6000. The proof is in the numbers. Dollar cost averaging into a trending market over time is the simplest and least stressful path to accumulating wealth.
Trading With MACD 101
Written by Christopher Inks
This is a repost from a few months ago. It's a great lesson and worth revisiting! Chris was my mentor and I still spend a ton of time interacting with him and the community of TexasWest on Discord. Link at the bottom.
The MACD indicator, which stands for Moving Average Convergence Divergence, is a trend-following momentum indicator that belongs to a specific family of indicators known as oscillators. This means that it can be helpful in a trending market but not much in a ranging market since the indicator is designed to fluctuate between low and high bounds. As a matter of fact, a trader is more often going to lose money attempting to use the MACD in a ranging market than not.
It can be used to determine overbought and oversold conditions, determine the market’s momentum, and even to identify divergences that lead to reversals. It is also important for traders to understand that the MACD is, for the most part, a lagging indicator meaning that it tends to tell you what has happened which is useful in confirming a trend. But, as with most things, there is an exception and that is when using it to identify possible trend reversals. In this latter case, it can be viewed as a leading indicator.
How is the MACD Calculated
The Moving Average Convergence Divergence indicator is made up of the MACD line, the signal line, the zero line, and a histogram. By default, the MACD line is calculated by subtracting the 26 period EMA from the 12 period EMA. The further these two EMAs pull apart the higher the MACD line rises while the closer they come together the lower the MACD lines declines. The signal line is the MACD’s 9 period EMA and is plotted on top of the MACD to be used as a buy or sell trigger. When the MACD line is above the signal line the market is trending upward and when the MACD line is below the signal line the market is trending downward.
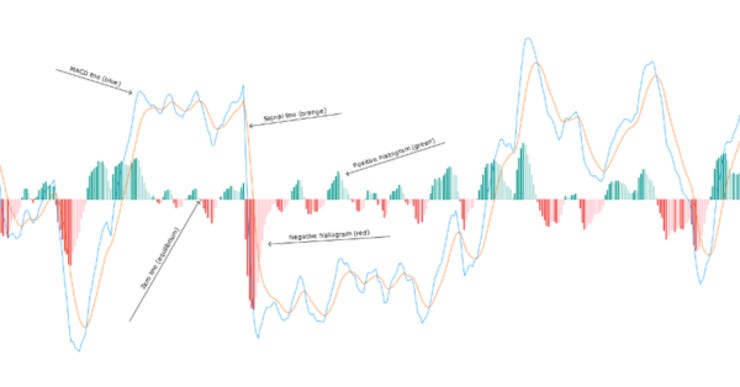
The zero line is the indicator’s equilibrium. This is the area of the indicator where the histogram fluctuates between positive (green) and negative (red). When the MACD is above the signal line it indicates that the market is more bullish. Conversely, when the MACD is below the signal line it indicates that the market is more bearish.
MACD’s histogram provides a visual for the distance between the MACD line and the signal line. As the MACD line pulls away from the signal line, the histogram expands. It then contracts when the MACD line pulls closer to the signal line. This can help traders identify when bullish or bearish momentum is increasing or decreasing. The histogram will be above the zero line when the MACD is above the signal line and below the zero line when the MACD is below the signal line.
How to Profit with the MACD
So how do we use the MACD to make money? As already mentioned, one way is to determine whether the market is more bullish or bearish by noting if the MACD is above or below the zero line. Another way is to determine whether the market is trending bullishly or bearishly. If the MACD is rising, then the market is understood to be trending bullishly and if declining then it is trending bearishly. But because this is lagging information, traders should not expect to use the MACD indicator in this way to buy the absolute lowest price or to sell the absolute highest price.
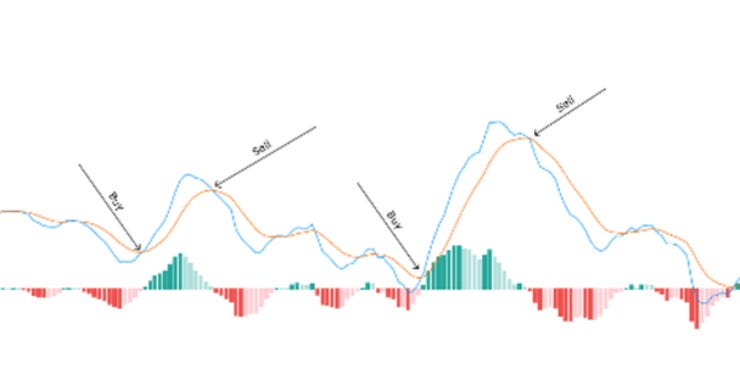
A third way to use the MACD indicator is to buy the asset or security when the MACD line crosses above the signal line (positive crossover) and to sell it when the MACD line crosses below the signal line (negative crossover). Again, traders will not be buying the absolute low or selling the absolute high, but the crossover can act as confirmation for an entry into, or exit out of, the market. The stronger the trend, the better this technique works. The positive crossover is most effective when it occurs below the zero line. The negative crossover is most effective when it occurs above the zero line. But the weaker the trend the more likely the indicator is to give false signals.
Divergences are a fourth way to use the indicator. Used in this way, the MACD becomes a leading indicator rather than lagging one. What traders want to look for are divergences between the indicator and price action. If price is making a higher high while the MACD is making a lower high, then that divergence may be signaling that the price is nearing a point where price will be reversing lower. And if price is making a lower low while the MACD is making a higher low, then that divergence may be signaling that price is nearing a point where it will be reversing higher.

Finally, traders can use the MACD’s histogram to signal when to enter or exit a trade. As with the divergence technique just described, if price is making a higher high but the histogram peaks are making lower highs, then traders should be prepared for price to reverse lower. And if the histogram troughs are making higher lows while price is making lower lows, then traders should be prepared for price to reverse higher. This divergence is often seen sooner than the MACD line and price action divergence thereby giving traders more of a heads up.

As with all indicators, the MACD should not be used as a trader’s sole reason for entering or exiting a trade. Higher confidence is found in confluence. This is when a trader combines multiple trading techniques or analysis thereby increasing the likelihood that the signal is legitimate. If the MACD provides a signal, traders are best served by looking at other indicators or candlestick patterns, for example, to see if they are also giving the same signal. The more confluence a trader has with a signal, the more likely they are to complete a winning trade.
For more information like this and to interact with Chris on a daily basis, join his Discord and take his course! - https://howtotradetowin.com/
The Keely Motor Company
In 1872, an American inventor named John Keely raised money on the promise of a new motor with a power source that would revolutionize the world. The only problem? It was an elaborate fraud. One with eerie similarities to certain modern day events. Who's up for a story?
John Ernst Worrell Keely was born in Chester, Pennsylvania in 1837. Orphaned at a young age, his grandparents raised him on the outskirts of Philadelphia. Keely was bright and energetic, taking on jobs like orchestra leader and carnival barker before becoming a mechanic.
But while his means remained modest, his dreams were anything but. Keely was determined to make it big. He had an ability to create what future generations would refer to as a "reality distortion field" with his charisma. So in 1872, he set about distorting reality...
Keely invited scientists and investors to his Philadelphia laboratory for a demonstration of a revolutionary new technology. He claimed that he had discovered a new source of power, capable of previously unheard of efficiency and output.
Keely explained to those gathered that the new source of power was from an "etheric force." He claimed he had found a way to harness the vibrations of atoms in water as fuel for machines. This force would allow one quart of water to power a train round trip from SF to NYC!
With his hook now planted, Keely formed the Keely Motor Company, persuading a dozen or so scientists and capitalists to invest in his business. He went on a grand speaking tour around the Northeast, using his easy charisma to persuade new investors to join the revolution.
With his reality distortion field in full effect, Keely raised $5 million (>$100 million today) from a long list of investors and the general public. He had placed his own name alongside Thomas Edison and Alexander Graham Bell on the list of great American inventors.
But with this money came great expectations. Keely would actually have to deliver on his promises! Or so you would think... In 1874, he gave the first demonstration of his "working" prototype engine, making a show of guarding the secrets from the audience of onlookers.
At the demonstration, he used phrases like "hydro-pneumatic-pulsating-vacu-engine" to wow his audience. A spectator noted, "Great ropes were torn apart, iron bars broken in two or twisted out of shape...by a force which could not be determined." The bravado worked, at first.
But as time passed and no products were brought to market, his investors grew increasingly wary of what was happening. Each time his investors, scientists, or the public would question the legitimacy of his operations, Keely would unveil some new technology designed to amaze.
Keely avoided filing for any patents, telling investors he didn't want to reveal his secrets to anyone, especially the patent office. Despite the red flags, investors continued with their support. Even John Jacob Astor, one of the wealthiest men of the era, became a backer.
Amazingly, John Keely was able to keep his elaborate fraud afloat for 26 years. For each ounce of skepticism that came his way, he piled on a pound of confidence. When he died in 1898, he left an estate of $10,000 to his widow, having burned through all the investments.
The Keely Motor Company never produced a product, never made a profit, and never paid a dividend. Only after his death did newspapers uncover the rouse. To this day, the question remains: was John Keely a brazen fraudster, or simply an ambitious man who got over his skis?
As you may have realized, the story of John Keely has eerie similarities to certain modern day events (cough, Nikola, cough). So what do you think? Does history rhyme, or are the similarities imagined? I'd love to hear your thoughts!

A Crypto Bank In The United States!
This is HUUUUUUUUUGGGGGGGGGE!
Sorry for yelling. But this is absolutely massive for mainstream adoption. I have always asserted that one of the main barriers to mainstream adoption is the necessity for people to custody their own Bitcoin. Most people do not want the responsibility of being their own bank. They want to custody their assets in a normal bank - an institution that they trust, is insured and that they have been taught to transact with their entire lives.
“We would expect to offer a host of new products as we get established,” Kinitsky said. “Those will range from things like qualified custody for institutions, digital-asset debit cards and savings accounts all the way to new types of asset classes. We can engage with securities and commodities and things like that as a bank. So a lot more TBD there.”
The state-charter as an SPDI does not allow them to lend, and it requires them to hold 100% of its assets in reserve. This is bullish for price - they will have to own a ton of Bitcoin as it ramps up.
The state-charter will allow them to move seamlessly into other jurisdictions, surpassing a ton of the red tape that would be problematic in other states.
I am pumped.
The Bahamas Adopting Digital Currency

In the office betting pool for "which country will be first to launch a central bank digital currency," few people probably had their money on The Bahamas. It seems that the world's first experiment with a CBDC will come from the tiny island nation directly to the south of my hometown.
“A lot of residents in those more remote islands don’t have access to digital payment infrastructure or banking infrastructure. We really had to customize the effort and the solution to what we need as a sovereign nation.”
Digital money clearly solves a major problem for the unbanked of the world, giving them the ability to easily transact without a bank through their mobile phone. We have seen this all over the world (particularly in Africa). Now we have an actual government adopting this means of transacting officially.
It will be interesting to watch this experiment play out in real time.
India Moves To Ban Crypto Trading (Again)
India - a country housing almost 20 percent of the world’s population - is planning to propose a bill to end crypto trading. If passed, the law would stand in contrast to surrounding Asian countries that have embraced crypto trading and the space as a whole. The details of the proposal are yet to be seen but it is reported that blockchain development won't be stifled or impacted, just the trading of crypto. Due to the announcement, exchange volume has spiked across the country, presumably from traders offloading their crypto and preparing for the ban. The new legislation is most likely the result of unchecked fraud within the country due to a lack of regulation.
Trading has been the first real use case of crypto in practice, so it will be interesting to see if India can keep up with innovation after the rug is pulled.
Kiyosaki Predicts Post Vaccine Market Crash

Robert Kiyosaki, a famous investor, and author of Rich Dad Poor Dad made a bold Twitter prediction - If a COVID Vaccine is proven, gold, silver, and Bitcoin will crash. Kiyosaki, a Bitcoin proponent didn't comment further why the vaccine would result in a crash but did mention the real issue is the U.S. debt. There are a lot of contingencies to his statement becoming true, but Kiyosaki is probably thinking the market will react negatively and forecast a shift in government policy when a vaccine arrises. It will be interesting to see if this rings true.
Pomp Captures Portnoy

Pomp will have a chance at converting Portnoy, the retail king of stocks, to crypto. There are better odds of Pomp getting through to him than the Winklevoss twins. At least we hope.

The Wolf Of All Streets Podcast Ft. Richard Byworth
Richard Byworth is the CEO of Diginex, a multi-faceted crypto company paving the way for the largest players to enter the space. Before developing Diginex, Richard was a professional trader, focused heavily on derivatives in legacy markets. After reading "Sapiens" and becoming fascinated with Bitcoin, he decided to focus on developing institutional grade tools for crypto investors - leading to a listing of his company on the Nasdaq.
Richard and I further discuss the experience of trading derivative through the 2008 crash, acquiring Lehman Brothers, the “loser” talking about Bitcoin in 2009, moving to Hong Kong, suitcases full of cash in the streets, facilitating OTC deals, listing Diginex on the NASDAQ, the ICO craze in 2017, DeFi and Hotdog Coin, living in the Bitcoin echo chamber, “this time feels different,” your barber teaching you about Bitcoin, helicopter money and more.

Chart Requests
CORT (CORCEPT THERAPEUTICS)
This did exactly what we expected from the last update - it broke out from the descending broadening wedge and continued up. You can see that price is currently sitting on a local support, so it will be interesting to see how the day and week close. This could be a decent entry, but it's a bit more risky after such a big move. I think the real trade here was the break of the descending black line then the blue line.
There was also a golden cross of the 50 and 200 MAs recently. Generally nothing bearish about this chart.
DIA/BTC
There's almost no price history here, so hard to judge. Looks bad, no thank you for me! Breaking support, hard to determine where a bottom will be in price discovery. You could consider if it recaptures that support or if it breaks the descending black line. Really no reason to chart or trade this for now.
DOT/USDT
Really not sure here. Seems a bit symmetrical triangle broke down, so this move up could just be a retest of resistance. That said, it does not look so bad otherwise. I would wait for a break of the descending black line to consider a position now.
ENG/BTC
I am still watching this on the weekly and it looks fine. I have about 30% of my position left, which I intend to continue riding. I would not be surprised to see quite a bit of drop on this pair again before continuing up, but the macro picture here would indicate that the large move is just starting. That said, it's between levels so nothing to do at this moment.
ETH/USD
I really don't know! This has me a bit confused for the first time in a while, but I see no major reason to panic. It recaptured a key level around $364 so far, so above that is encouraging. We also had confirmed hidden bullish divergence to nullify the bear divs on the daily chart. The chart is weird, largely depends on what BTC has in store for us next. I'm just continuing to dollar cost average and not overthink it, personally. Can't see a reason to be trading for now though.
KNC/BTC
Another alt that is sitting on support but looking weak. I could see taking a position here if you like catching a knife, but I would not. Really just looks like an ugly chart and I would wait for any sign of a real reversal instead of trying to catch the bottom.
LINK/USD
Not much to see here, really no reason to do anything based on the chart. Floating between meaningful levels. I would buy a touch of the red ascending support with a tight stop, especially if it hits around 9.16, the white support line. Otherwise, this is trending generally down for now unless it breaks the white descending line. Alts just don't look great.
LTC/USD
I really don't like this here at all. The chart looks surprisingly bad (probably means it will pump, right!?). Clear break of the ascending red support which is not resistance on multiple candles. Price appears to also be making a bear pennant, which should see a significant drop if it breaks down. I would look at lower levels if that happens, as LTC should do well long term. Right now, this is ugly.
NEO/BTC
This has made some amazing moves over the past few weeks - it was completely off my radar and I did not even see it. You can see that this topped out for a while, with clear bear divs on RSI. Now it is between levels, so I don't see a clear trade here. Perhaps RSI has reset, but it has not confirmed a hidden bull div which can be a good signal it is ready to continue. I would either take a position higher or lower, honestly. Higher it it breaks resistance and lower if it hits support.
OMG/USDT
Sitting on support like many coins, but not much sign of buying. I can't see a reason to trade this. The 50MA also just broke down, which is not great. Maybe on a break of the descending line, if it happens. Alts just don't look great today.
SC/BTC
Not looking great, but sitting on support like many alts. 29 is really a key support, followed by the bottom of the ascending channel. Below that, we would expect to visit all time lows. You want to hope this does not break down. That said, a trade here is not a terrible idea with a tight stop, since it is sitting right on support.
XVG/BTC
This is sitting on a key support at 41, after breaking down below it on the last drop. Not much to love here, unless you are in the mood to catch a knife. Long term, this should be "cheap," but a break down here should send it down to the all time low once again. If it can hold 41, it looks good, so not a terrible punt at this level.
ZRX/USDT
Sitting on a key support here, flirting with the breakdown of a head and shoulders which would be a clear top. It's on support, so it could be a good trade with a tight stop if you believe alts are going to head back up. If it breaks down, we should see far more downside on this pair.
My Recommended Platforms And Tools
This is where I trade with leverage and can also trade spot with no fees.\
This is where I spend my days teaching and learning! Our Discord group is a one stop shop for everything you need to learn to trade and control your emotions. Feel free to DM me on Twitter or respond to this email for questions.
This is where I invest, commission-free. They now let you earn interest on your Bitcoin held in Voyager, so you can compound while trading. Not only that, you’ll get $25 in free BTC when you download & fund.
Rewards Code: Scott25
I use RoundlyX to buy small amounts of Bitcoin every single day. They automatically round up my credit card purchases (with 10x multiplier) and invest them in crypto. Absolutely brilliant. Passively invest money you don’t need without a thought. Further, they have integrated with Voyager (see above) to offer commission-free purchases.
Rewards Code: WOLF
My preferred crypto tax software.
Binance is finally available in Florida!
Self-Directed IRA for Americans - allows you to invest in Bitcoin and any other asset for your retirement, with all of the tax benefits of a normal IRA.
Concierge Phone Service for Americans that protects your from SIM Swaps and other phone related hacks. I cannot stress enough how amazing this service is.
Follow me on Twitter at @scottmelker. This is where I am constantly updating my trades and sharing ideas.
The views and opinions expressed here are solely my own and should in no way be interpreted as financial advice. Every investment and trading move involves risk. You should conduct your own research when making a decision. I am not a financial advisor.