


The Wolf Den #840 - CoinGlass Is The Future
Cool new platform alert.

Welcome to The Wolf Den! This is where I share the news, my ideas about the market, technical analysis, education and my random musings. The newsletter is released every weekday and is completely FREE. Subscribe!
In This Issue:
CoinGlass Is The Future
Bitcoin Thoughts And Analysis
Altcoin Charts
The Brakes Finally Come Off Japanese YCC
Gemini Sues Genesis
Bitcoin Searches Are On The Rise
Stanley Druckenmiller On Bitcoin
Warning! War Threatens $1 Trillion Blow To The Economy! Bitcoin To Explode?
CoinGlass Is The Future
I am absolutely blown away by what’s possible on CoinGlass. The only way I can describe what navigating CoinGlass feels like in non-crypto terms is that it’s akin to walking into Disney, Costco, and a Walmart Supercenter at the same time. My jaw literally drops to the floor.
If you're already well-versed in platforms like CoinMarketCap, CoinGecko, TradingView, and GlassNode, and you're seeking a substantial system upgrade, then considering CoinGlass is the next logical step. Just to clarify, this isn't a sponsored message or advertisement; I occasionally write about and review platforms, and this time, CoinGlass happens to be the standout feature. I don’t know a single person there or have any relationship with them.
Sad that I have to say that, but always good to give clarity.
Before delving into what CoinGlass offers, it's crucial to emphasize that this platform isn't a replacement for any of the platforms I already mentioned. GlassNode, for instance, continues to be a specialized service for on-chain analysis, while TradingView stands out for offering some of the finest indicators and charting tools. CoinGlass isn't an all-encompassing solution, it’s derivatives-focused. Think of it as a new super-tool added to your arsenal for navigating the crypto space.
From this point on, I am going to share a handful of cool features I found on CoinGlass. In addition to the tools, I copied some key text that adds context to the images. Also included are the steps on how to navigate to this feature, from the home page. Enjoy.
Futures Calculator
Data —> USDT/USD Margined Calculator —> PNL Calculator

Bitcoin Profitable Days
Data —> Technical Indicators —> Bitcoin Profitable Days

Number of days in Bitcoin's traded history where holding Bitcoin has been profitable relative to today's price.
This chart highlights the aggressive growth of Bitcoin's adoption curve over time, which is reflected in its price. Because supply is limited, as demand grows price moves up.
For investors, it also demonstrates the importance of understanding the market cycles of Bitcoin to avoid buying market cycle tops. The drawdowns from cycle tops can last a long time, around 2-3 years in previous cycles.
How To Chart
(click) Superchart

Price Performance
Data → Bitcoin Returns % → BTC quarterly,monthly and weekly price performance(%)

Since 2011, the cumulative growth of Bitcoin has exceeded 20,000,000%, far surpassing the cumulative growth of 541% for the Nasdaq 100 Index and 282% for major US stock indices.
When considering annualized returns, Bitcoin's rate of return stands at 230%, which is 10 times higher than the second-best performing asset class, the Nasdaq 100 Index.
Over the same period, large US stocks experienced an annualized return of 14%, high-yield bonds saw a growth of 5.4%, and gold had a return rate of 1.5%.
Quarterly Returns
Data → Bitcoin Returns % → Quarterly Returns %

Since 2011, the cumulative growth of Bitcoin has exceeded 20,000,000%, far surpassing the cumulative growth of 541% for the Nasdaq 100 Index and 282% for major US stock indices.
When considering annualized returns, Bitcoin's rate of return stands at 230%, which is 10 times higher than the second-best performing asset class, the Nasdaq 100 Index.
Over the same period, large US stocks experienced an annualized return of 14%, high-yield bonds saw a growth of 5.4%, and gold had a return rate of 1.5%.
Liquidation Map
Liquidation —> Liquidation Map

A liquidation map, also known as a "liq map," provides a visual chart of liquidations or liquidation risk in the futures cryptocurrency trading market. It displays liquidations that are predicted based on previous price trends.
When traders engage in trading on unregulated cryptocurrency derivative exchanges, they are constantly exposed to additional risks, namely liquidation risks. When the liquidation price of a trader's position is triggered, their position is forcibly closed by the exchange's risk engine.
Stock-to-Flow Model
Chart → Technical Indicator → Stock-to-Flow Model

In addition to the main stock-to-flow chart, I have created a divergence chart (lower section of the chart) which shows the difference between price and stock-to-flow. When the price moves above stock-to-flow (the divergence line turns from green to red), thereby allows us to easily see how price interacts with stock-to-flow through market cycles over time.
Binance Top Trader
Long/Short —> Binance Top Trader

This refers to the ratio of the total long and short positions held by top traders, specifically the proportion of net long and net short positions to total open positions of the top 20% of users with the highest margin balance.
Interpretation of the indicator: It allows retail investors to intuitively perceive the position changes of top users and observe the timing of their opening and closing positions.
As you can see, there are some very useful and novel tools here. Enjoy your deep dive!

Bitcoin Thoughts And Analysis

Nothing has changed here. RSI is resetting nicely as price goes sideways - that’s what you want to see. For now, nothing of interest between $33,000 and $35,157.
You can see we had bearish divergence with overbought RSI here to show us the top… as often happens. Watching for the same on the daily.
Altcoin Charts
For those who are new here, I share SETUPS and not SIGNALS. These are ideas that I am watching - if a certain thing happens, then the trade triggers. I am not telling you what to buy or when. I am showing you how I am watching certain charts and what has to happen for me to take a trade.

Ethereum is oversold on the weekly chart vs. Bitcoin for only the 4th time in history. The last two times that this happened, Ethereum saw major bottoms before huge rallies. The first time price rose significantly, but then continued down.
RSI can continue well into oversold and price can continue well down, of course. But it’s time to start looking for the bottom. My thinking is that it could likely come around .049, the last key support in this area.
This is a bit of a weathervane for the entire alt market.
The Brakes Finally Come Off Japanese YCC
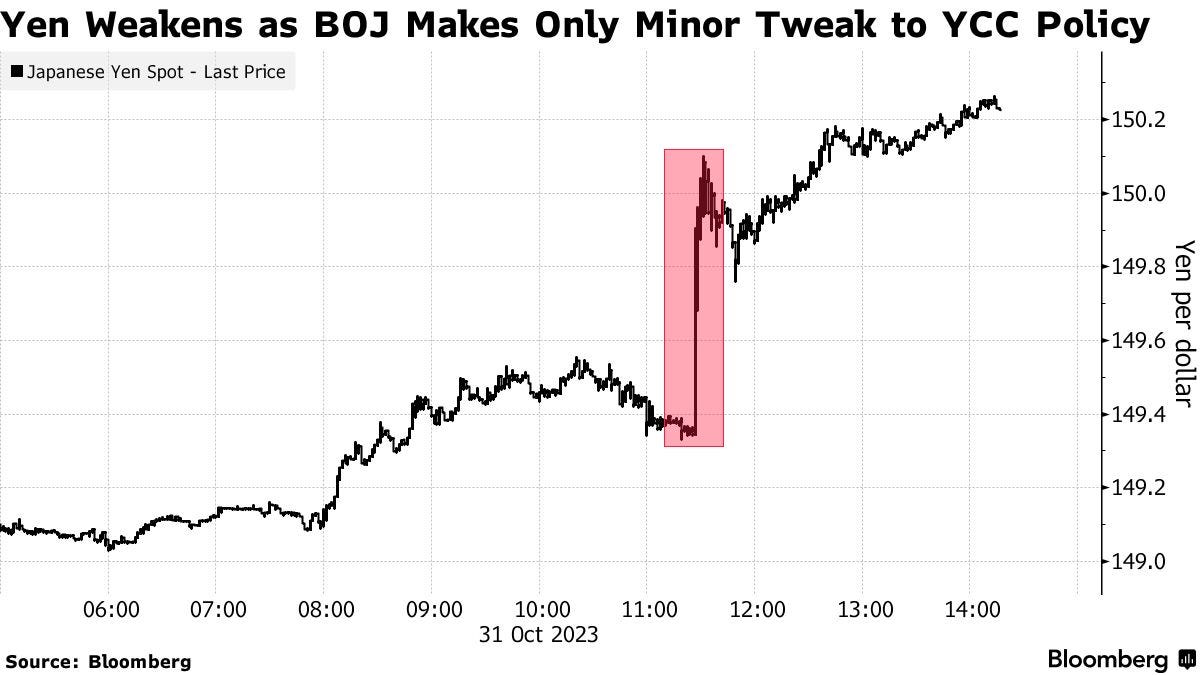
The yen experienced its most significant decline in two months after the Bank of Japan (BOJ) made only minor adjustments to its policy, not meeting the expectations of some in the market. Post-decision, the currency went beyond 150 per dollar. European stock markets saw a rise due to strong earnings from Anheuser-Busch InBev NV and Stellantis NV. S&P 500 futures also showed positive movement, likely continuing the momentum from Monday's 1.2% rally. This comes after the US Treasury lowered its borrowing estimate for the current quarter, attributing it to higher-than-anticipated revenue.
Since introducing yield-curve control in 2016, the BOJ's moves have been closely observed by investors. The bank announced a more flexible stance on controlling yields on 10-year government debt, deviating from its previous commitment to daily bond purchases at 1%. Simon Harvey, head of fx analysis at Monex Europe, mentioned the situation as a test to see how Japanese officials react to the yen's depreciation rate.
Despite the currency's decline, Japanese equities, such as the Nikkei 225, are seeing gains, with the Nikkei increasing by 0.5% on Tuesday, pushing its year-to-date surge to 18%. Charles-Henry Monchau of Bank Syz highlighted the sustained loose monetary policy and cautioned against letting long-term bond yields rise further. In contrast, the global equity market, including the S&P 500, has not fared as well. In other global news, oil prices are recovering after a significant dip, with Israel increasing its operations in the Middle East. West Texas Intermediate oil prices have approached $83 a barrel.
Key events this week:
Eurozone CPI, GDP, Tuesday
US Conference Board consumer confidence, employment cost index, Tuesday
China Caixin manufacturing PMI, Wednesday
UK S&P Global / CIPS UK Manufacturing PMI, Wednesday
US construction spending, ISM Manufacturing, job openings, light vehicle sales, Wednesday
All Saints holiday in much of Europe, Wednesday
Treasury quarterly refunding announcement, Wednesday
Federal Reserve interest rate decision. Fed Chair Jerome Powell holds news conference, Wednesday
Eurozone S&P Global Eurozone Manufacturing PMI, Thursday
Bank of England interest rate decision. Governor Andrew Bailey holds news conference, Thursday
US factory orders, initial jobless claims, productivity, Thursday
Apple earnings, Thursday
China Caixin services PMI, Friday
Eurozone unemployment, Friday
US unemployment, nonfarm payrolls, Friday
Canada employment report, Friday
Here are some of the main moves in markets:
Stocks
The Stoxx Europe 600 rose 0.7% as of 10 a.m. London time
S&P 500 futures rose 0.2%
Nasdaq 100 futures were little changed
Futures on the Dow Jones Industrial Average rose 0.3%
The MSCI Asia Pacific Index fell 0.6%
The MSCI Emerging Markets Index fell 0.6%
Currencies
The Bloomberg Dollar Spot Index was little changed
The euro rose 0.4% to $1.0659
The Japanese yen fell 1% to 150.63 per dollar
The offshore yuan was little changed at 7.3307 per dollar
The British pound rose 0.1% to $1.2188
Cryptocurrencies
Bitcoin was little changed at $34,431.86
Ether rose 0.1% to $1,803.54
Bonds
The yield on 10-year Treasuries declined seven basis points to 4.83%
Germany’s 10-year yield declined three basis points to 2.79%
Britain’s 10-year yield declined seven basis points to 4.49%
Commodities
Brent crude rose 0.3% to $88.13 a barrel
Spot gold was little changed

Gemini Sues Genesis
Gemini Exchange Files Lawsuit Over $1.6 Billion Collateral Dispute

Crypto exchange Gemini and bankrupt Genesis, a crypto lending company, are fighting in court over $1.6 billion worth of GBTC shares. Gemini claims to have obtained $284.3 million by selling some of the collateral to support its Earn Program users, but Genesis disputes this action. They argue the initial value of the shares should dictate what users owe rather than the amount obtained by Gemini. Gemini asserts that, as they bore the market risks associated with the collateral for the benefit of users post-sale, any gains from that risk should rightly go to the users. This dispute is critical as it could potentially free up significant funds for other creditors. There are other problems too, like accusations of wrongdoing by the SEC and fraud claims by New York's Attorney General. Most people owed money by Genesis are from Gemini, and Genesis went bankrupt after stopping people from taking their money out.
Bitcoin Searches Are On The Rise

Bitcoin's Wikipedia page has been experiencing a surge in visitors, reaching levels not seen since mid-2022. The recent spike in interest coincided with Bitcoin's price rally, marking a record of 13,490 page views on October 24. Another indicator of Bitcoin's general interest is the Google Trends tool, revealing search scores around '77' within the past year and '29' relative to the past five years. This data seems to support the notion that the bull run is in progress, signifying the early stages of renewed interest in Bitcoin.

Stanley Druckenmiller On Bitcoin

Stanley Druckenmiller is one of the best (investors) to ever do it. Sometimes, it really is as simple as following what others do.
“I'm 70 years old, I own gold. I was surprised bitcoin got going but ... it's clear the young people look at it as a store of value because it's a lot easier to do stuff with and 17 years, to me, it's a brand. [But] I like gold because it's a 5,000-year-old brand. The young people have all the money. I like them both. I don't own any Bitcoin, to be frank, but I should.”

Warning! War Threatens $1 Trillion Blow To The Economy! Bitcoin To Explode?
Join Dave Weisberger, Mike McGlone, and James Lavish as we break down what's happening in macro and crypto!
My Recommended Platforms And Tools
OKX - Sign up for an OKX Trading Account then deposit & trade to unlock mystery box rewards of up to $60,000! Use my code HERE.
The Daily Close - Brand New Newsletter! Institutional grade indicators and data are delivered directly to your inbox every day, at the daily close. Trade like the big boys
Nord VPN - Get an exclusive NordVPN deal - 40% discount! It’s risk-free with Nord’s 30-day money-back guarantee. Protect your privacy.
Twitter - I spend most of my time on Twitter, contributing to CryptoTownHall every weekday morning, sharing random charts, and responding to as many of you as I can.
YouTube - Home of the Wolf Of All Streets Podcast and daily livestreams. Market updates, charts, and analysis! Sit down, strap in, and get ready—we’re going deep
TheWolfOfAllStreets.io - The most comprehensive collection of everything I have going on. Plus over 100 blogs and other exclusive content.
The views and opinions expressed here are solely my own and should in no way be interpreted as financial advice. Every investment and trading move involves risk. You should conduct your own research when making a decision. I am not a financial advisor. Nothing contained in this e-mail constitutes or shall be construed as an offering of financial instruments or as investment advice or recommendations of an investment strategy or whether or not to "Buy," "Sell," or "Hold" an investment.