


The Wolf Den #834 - Who Owns What?
The biggest Bitcoin holders may surprise you.

Welcome to The Wolf Den! This is where I share the news, my ideas about the market, technical analysis, education and my random musings. The newsletter is released every weekday and is completely FREE. Subscribe!
In This Issue:
Who Owns What?
Bitcoin Thoughts And Analysis
Altcoin Charts
Trading Alpha Charts
Treasury Yields Are A Wrecking Ball
Yield Curve Inversion
Everyone Now Predicts There Will Be A Spot ETF
Tom Emmer May Become Speaker Of The House
Live From Formula 1: How To Build A Generational Crypto Brand | Haider Rafique, OKX
Who Owns What?
The following Tweet shattered what I thought was previously true…

I don't believe many, if any of us, were aware that Block.one owned more Bitcoin than MicroStrategy or had much knowledge of the company itself. Let’s take a deeper look.
If you visit Block.one's website, you'll learn that it's a crypto-focused investment company with quite a large portfolio of investments. But with a little more digging, you’ll discover that Block.one is also the creator of EOS, a popular altcoin from the 2017 class that has struggled to regain its initial prominence. A quick investigation on WayBackMachine revealed that EOS briefly held the #5 position on CoinMarketCap in mid-2018 but has since become a zombie. One of thousands of coins that was supposed to replace Ethereum but instead has declined by a staggering 97.59% from its all-time high.
I tried to learn exactly how B1 acquired their Bitcoin and I couldn't find a perfect answer, but what I did find was that the founder of the company, Daniel Larimer, claims to be involved with Bitcoin since it was “worth only pennies.” That’s a good enough answer for me. So before I move on from B1, let’s wrap up a few things. B1 is important because it sits #1 in terms of private companies that own Bitcoin. B1 (164,000) owns more than Mt. Gox (141,686) and three times the amount of Tether (54,998). It’s possible that B1’s position is never passed. After all, 164,000 represents .78% of the 21 million supply and closer to 1% when you factor in lost coins.
With B1 out of the way, let’s now take a closer look at who owns what.
Among public companies, it's no surprise that MicroStrategy claims the top spot with 158,245 Bitcoin holdings, followed by Marathon (11,466), Tesla (9,720), and Coinbase (9,480). When you delve into the numbers, it's truly astonishing that to catch up to MicroStrategy, the #2 public company, Marathon, would need to increase its holdings by 13.8 times. What's even more mind-boggling is the size of Grayscale’s holdings, the largest fund in the crypto space, which boasts a substantial 624,947 BTC in its portfolio. This exceeds the combined Bitcoin holdings of all major private and public companies.
It's estimated that approximately 4 million Bitcoins are permanently lost. If this is true, the actual supply of 21 million is effectively reduced to around 17 million. Grayscale holds approximately 3.67% of all circulating Bitcoins. When you factor in other significant holders such as B1 (0.96%), MicroStrategy (0.93%), Mt. Gox (0.83%), and the combined holdings of the smaller companies (0.5%) that I mentioned earlier, a handful of companies collectively account for roughly 7% of the total Bitcoin supply. Long story short, the supply is only shrinking and our chances to accumulate meaningful positions ie. .1, .5, 1, or even more Bitcoin is an increasingly difficult feat.
Consider the potential scenarios when a second wave of public and private companies competes for substantial Bitcoin holdings. Names will pop up on the map we didn't see coming.
Moreover, with the impending approval of spot ETFs, Grayscale will face increasing competition to maintain its top position in the funds and ETF category. Another noteworthy possibility that nobody is thinking about right now is the likelihood of more nations adopting an approach similar to El Salvador. Imagine if, while Wall Street is steadily embracing crypto, a few more sovereign nations decide to take the leap as well.
The question of 'Who Owns What?' is bound to become an intriguing topic to explore during the bull market.

Bitcoin Approaches Yearly High
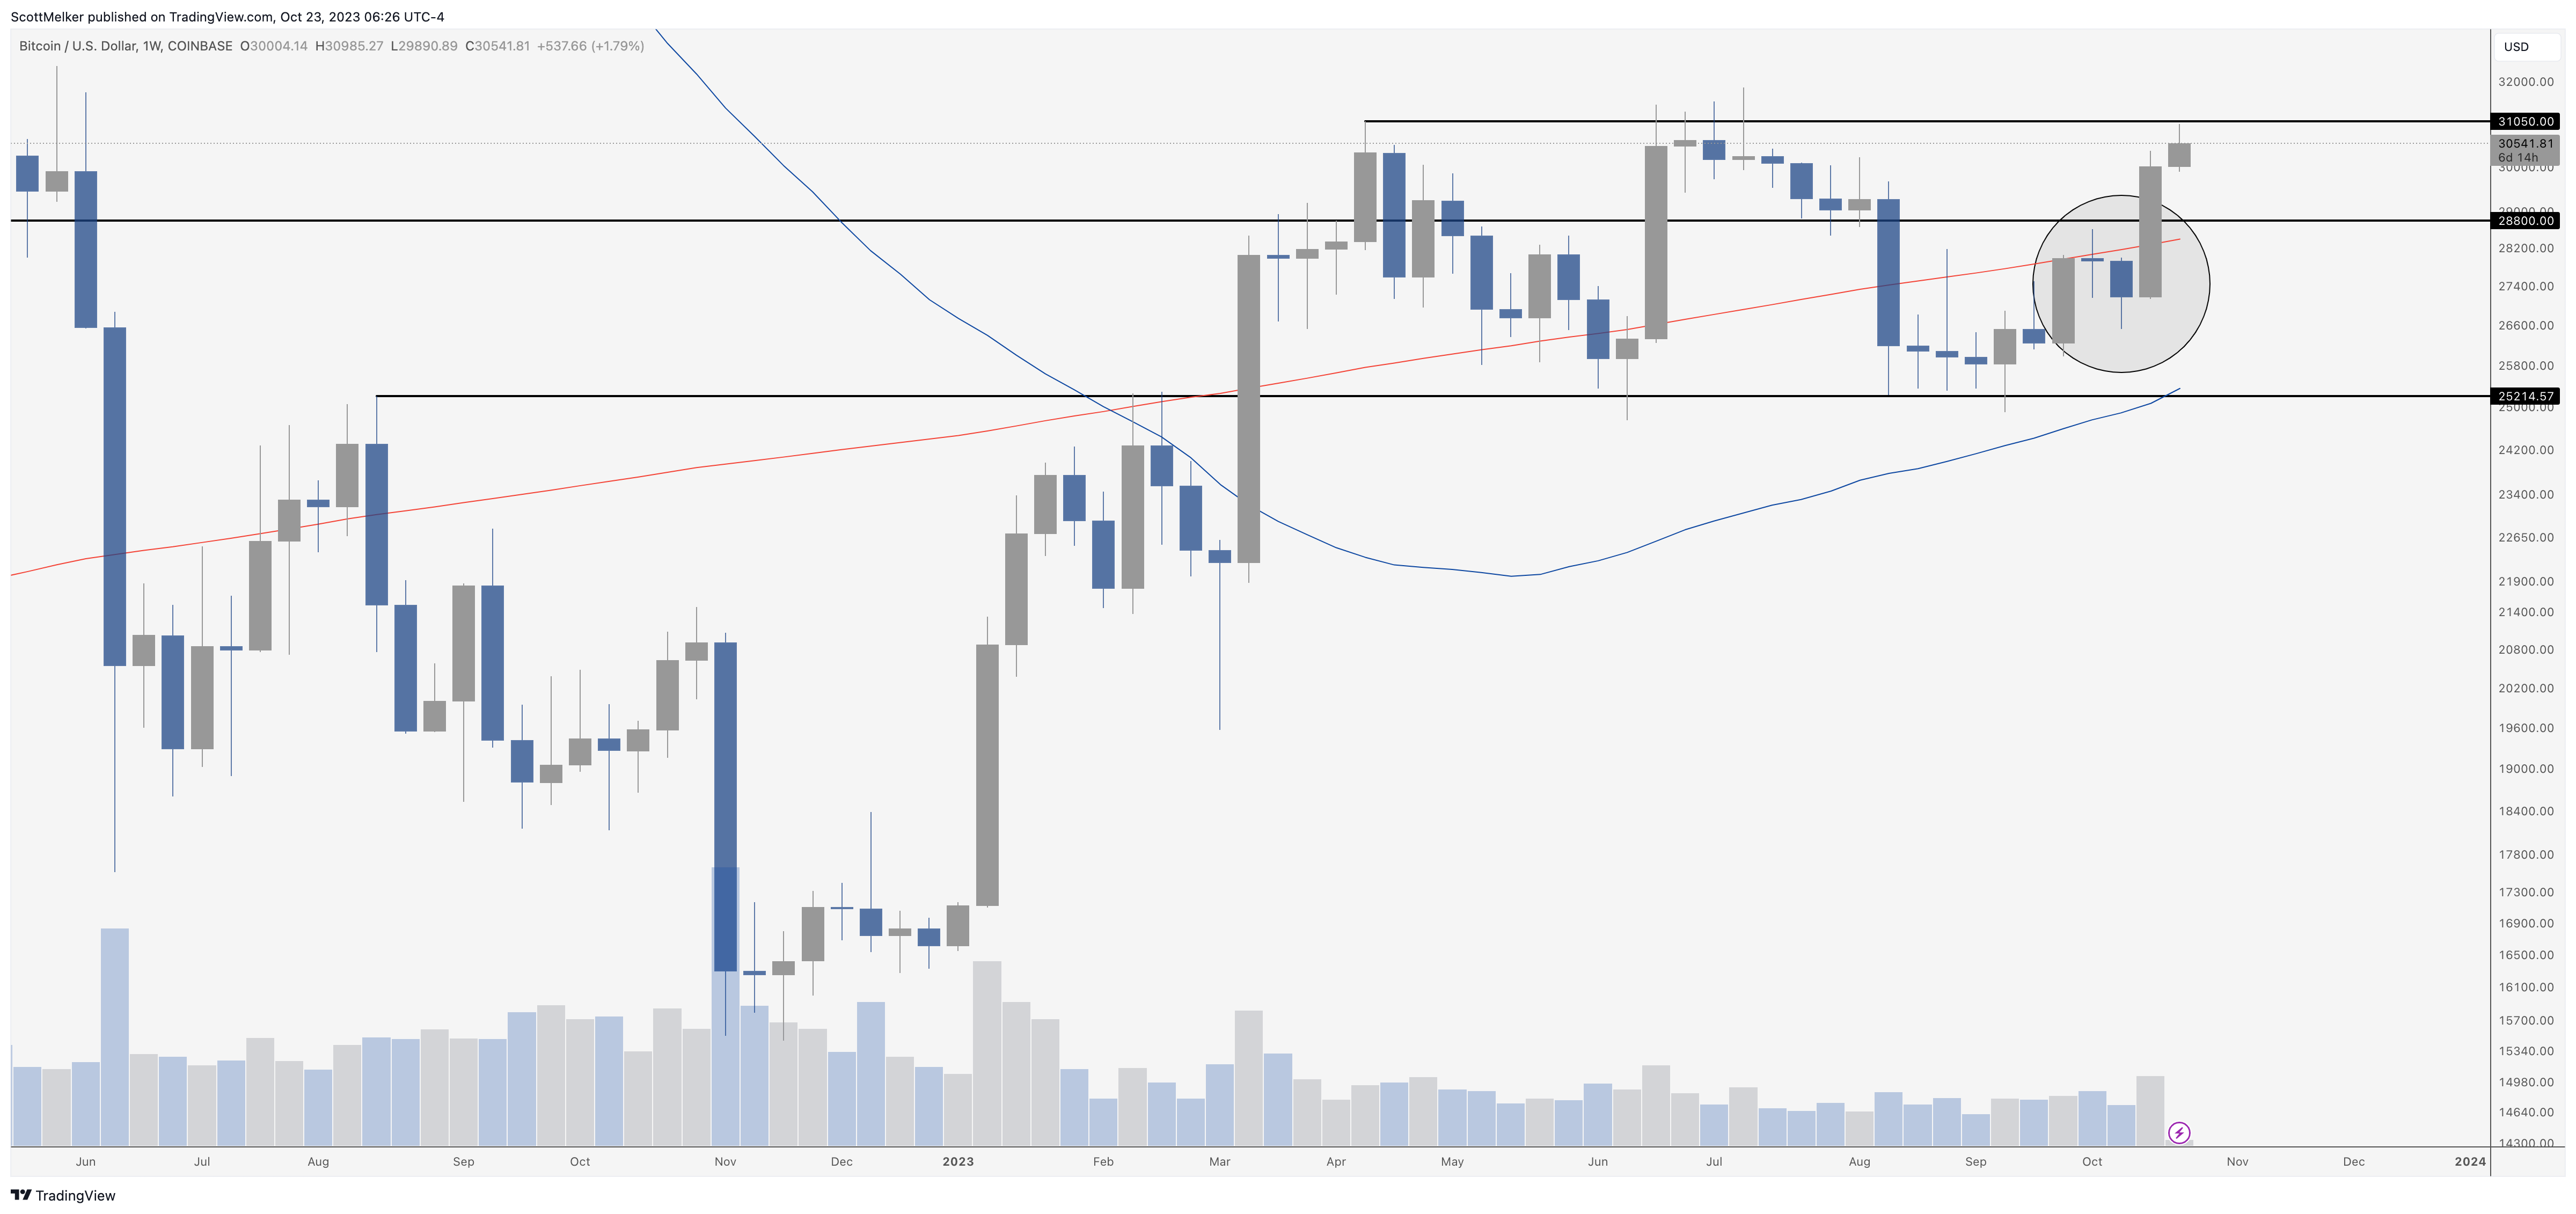
Bitcoin tapped the $31,000 area (depending on the exchange), approaching the yearly highs. We have seen impressive follow through this week after the “fake ETF pump” from a week ago today. More importantly, Bitcoin is showing significant divergent strength in the face of a strong dollar and raging yields. Stocks are under pressure, but Bitcoin continues to rise and be an uncorrelated asset.
As you can see, price, is now strongly above the 200 MA, and both the 50 and 200 MAs are curved up, indicating that the trend is up as well.
There are two major ranges we have been trading in this year - $25,000 to $28,800 and $28,800 to $31,000. We moved through the entire upper range in a week.
But… that means we are AT RESISTANCE. While I am cautiously optimistic, this is the area that most shorter term traders would take profit. $25,000 was the clear time to buy at support, and the break of $28,800 or so was the other place. Now we need to see the yearly highs flipped and then buy it as support.
A retest of the 200 MA as support (may not happen) would be a nice place to look for an entry.

Daily RSI is well into overbought, but that certainly does not mean it can not push further. That said, $31,862 looks like a logical local top if it can extend that far. That is the yearly high and the next clear resistance.
Remember, this entire move was started by bullish divergence with oversold RSI on the daily chart at key support - $25,000. It was discussed at length here and is historically the strongest signal that I can find. Perhaps the top here will be a bearish divergence, if it forms. Usually is.
Altcoin Charts
Altcoins are looking decent! I am seeing setups where they are finally exiting accumulation or breaking out. I am always cautious, because I know the trend can end quickly, but my guess here is that Bitcoin consolidates and select alts make nice moves. We have already seen $LINK breakout from 18 month + consolidation, which could be a sign. Here are a few quick charts and thoughts.

What a move from LINK. As you can see, it has broken out of 18 months of accumulation. This move perfectly started at the EQ of the blue range, the dashed center line.
That said, this looks over extended. Today’s candle looks toppy, but is not closed yet. RSI is massively overbought.
If I was looking to enter this, I would never do it now after the huge green candles. I would wait for a nice dip, willing to miss it if it does not happen. The top of the range is an obvious place to look for a dip as a retest. A dip back down to $8.79 would be nice as well.
*I own LINK.

MATIC may finally be breaking out, clearing the descending blue line that has been resistance since February.
.50 was a nice area of support that was tested a number of times. This was a scary buy for most, because price consolidated there for so long.
We want to see a strong close above resistance at this point, then ideally look for a retest. The 60 cent area is now the support to look for. The 200 MA is screaming down over head, so that remains a clear warning sign and resistance.
I want to see a strong breakout here, on increasing volume, which we have starting so far.
* MATIC is one of my largest holdings

I know, I know, SHIB. Memecoins are a complete joke, but that does not mean they can’t be traded for profit.
This seems to be testing the range lows after attempting to flip them back to support. Right around 714. A close above that level looks like a relatively easy trade, with a target around the range EQ (dotted line). That is 1135… a nice trade.
This looks like LINK at $5, at the range low.
Trading Alpha Charts
BTC
4-HOUR CHART

Last time we shared the Daily chart setup and let everyone know Bitcoin was trying to target range highs. We were correct & have now reached those range-high areas.
What to do now: at these range highs if we are swing trading medium term then we need to start thinking pro-actively now. Because we run the risk of reverting to range lows again. That said, as long as we have green Dots on this 4hr chart we can expect higher pricing. It’s when the Dots end that we should pay attention & possibly cut the trade.
Hypothetically if we had to exit on weakness we can always wait for the next setup. Never be scared to lock profit on swing trades. There is always another setup.
SOL/USD
4-HOUR CHART

Solana has been a name that many are wanting to participate in when the bull market comes. It’s one of my personal choice favorites to trade as well.
The Setup: After seeing the blue Bottoming signals, all we needed was a signal that the trend was strengthening. We got that sign, as the micro trend Dots started to print green.
What to do now: At this point we wait to possibly exit if we lose green Dots. Then simply wait for the next high-probability setup. Or if you were not in this move, don’t chase it, that is almost never a good choice. Instead, be patient & just wait for the next setup.
TLT
MONTHLY CHART

I would like to highlight the 20-year US Treasuries here.
The levels we are seeing are now the lowest they have been since 2007, just before the 2008 housing crisis/recession.
Very interesting to watch, as most economists are still calling for a recession that has not yet come. Are they wrong, or are they early?
What tiers & payment options are there in the Alpha Bundle?

We have two tiers and they are broken up between the two payment options we have. One is a monthly option with a couple fewer features/indicators within the Alpha Bundle package, and the other option is the annual plan that offers a few of our most premium indicators within the bundle, that are not in the monthly plan.
Monthly subscription to Alpha Bundle = $99/month
Yearly subscription to Alpha Bundle = $1188/year
There is a 2-month free discount code that we have made exclusively for WOAS members on our annual plan of the Alpha Bundle, use code ‘2MonthsOff’.
Over the coming days, I will continue to share more about these two bundles.
Use my my link HERE, to sign up.
(For more education, or a live video walkthrough & detailed explanation of these charts see my page on Twitter @ZeroHedge_)
Treasury Yields Are A Wrecking Ball

Global stocks are on a downward trend following a spike in the 10-year Treasury yield to 5%, igniting fears that higher borrowing costs might impede economic growth. The yield escalation to its peak since 2007 led to a slump in various market indices and a dip in copper prices, indicative of apprehensions surrounding the industrial economy. This bond market activity is under the spotlight as the US enters its earnings season amidst a robust economy, with the Fed's stance on high interest rates awaiting inflation moderation, pushing investors toward a bearish outlook on riskier assets. Corporate earnings disappointments further soured market sentiment. In geopolitical spheres, tensions in the Middle East are on traders' radars due to recent developments between Hamas, Israel, and Lebanon, potentially influencing market dynamics. Upcoming inflation data from Australia and Japan, economic activity figures from the US and Europe, and key policy announcements from monetary authorities are anticipated to provide insights into the global interest rates trajectory, with market reactions in Argentina post-elections hinting at an uncertain climate for investors.
Key events this week:
Taiwan jobless rate, industrial production, Monday
Eurozone consumer confidence, Monday
EU foreign ministers meet in Luxembourg, Monday
Reserve Bank of Australia Governor Michele Bullock speaks in Sydney, Tuesday
Eurozone S&P Global Services PMI, S&P Global Manufacturing PMI, Tuesday
UK S&P Global / CIPS Manufacturing PMI, jobless claims, unemployment, Tuesday
US S&P Global Manufacturing PMI, Tuesday
UN Security Council is expected to open debate on the Middle East, Tuesday
Microsoft, Alphabet earnings, Tuesday
Australia 3Q CPI, Wednesday
Germany IFO business climate, Wednesday
IBM, Meta earnings, Wednesday
South Korea GDP, Thursday
European Central Bank rate decision, Thursday
EU leaders summit in Brussels, Thursday-Friday
US wholesale inventories, GDP, US durable goods, initial jobless claims, Thursday
Intel, Amazon earnings, Thursday
Japan Tokyo CPI, Friday
China industrial profits, Friday
US personal spending and income, University of Michigan consumer sentiment, Friday
Exxon Mobil earnings, Friday
Some of the main moves in markets:
Stocks
The Stoxx Europe 600 fell 0.8% as of 11:11 a.m. London time
S&P 500 futures fell 0.6%
Nasdaq 100 futures fell 0.8%
Futures on the Dow Jones Industrial Average fell 0.7%
The MSCI Asia Pacific Index fell 0.9%
The MSCI Emerging Markets Index fell 0.9%
Currencies
The Bloomberg Dollar Spot Index was little changed
The euro was little changed at $1.0596
The Japanese yen was little changed at 149.97 per dollar
The offshore yuan was little changed at 7.3246 per dollar
The British pound fell 0.1% to $1.2147
Cryptocurrencies
Bitcoin rose 2.1% to $30,494.97
Ether rose 2% to $1,673.38
Bonds
The yield on 10-year Treasuries advanced 10 basis points to 5.01%
Germany’s 10-year yield advanced eight basis points to 2.97%
Britain’s 10-year yield advanced eight basis points to 4.73%
Commodities
Brent crude fell 0.3% to $91.89 a barrel
Spot gold fell 0.2% to $1,977.87 an ounce

Yield Curve Inversion
You have likely heard this term countless times over the past year. But maybe you don’t know what it is or why it is important.
A yield curve is a graphical representation of interest rates on debt for a range of maturities, showcasing the relationship between the interest rate (or cost of borrowing) and the time to maturity of the debt. A normal yield curve is upward-sloping, indicating that longer-term bonds have a higher yield compared to shorter-term bonds, which compensates investors for the additional risks associated with time.
A yield curve inversion occurs when short-term interest rates surpass long-term rates. People usually look at the 2-year and 10-year. Here are key points regarding its significance:
1. **Recession Indicator**: - Historically, an inverted yield curve has been a reliable indicator of an upcoming recession. It suggests that investors have less confidence in the economic outlook, and are willing to accept lower yields for long-term investments as they seek safer havens for their money.
2. **Monetary Policy Implications**: - The inversion can reflect tight monetary policy with higher short-term interest rates. It often prompts central banks to alter their policy stance, possibly by reducing rates to stimulate economic activity.
3. **Bank Profitability**: - Banks generally borrow short-term and lend long-term. An inverted yield curve narrows the spread between what banks pay for deposits and what they earn from loans, which can squeeze their profitability and restrain lending.
4. **Investor Behavior**: - The inversion might influence investor behavior as it alters the risk and return profile of various assets. It may lead to a flight to quality, with investors moving funds into safer assets, or seek higher returns in riskier markets if traditional bond yields are unattractive.
5. **Market Sentiment**: - An inverted yield curve can negatively affect market sentiment as it often headlines as a harbinger of economic doom, which might in turn affect consumer and business spending decisions. Understanding the dynamics of the yield curve and its inversion is crucial for both policymakers and investors as they navigate the financial markets and make decisions under varying economic conditions.
Understanding the dynamics of the yield curve and its inversion is crucial for both policymakers and investors as they navigate the financial markets and make decisions under varying economic conditions.

Everyone Now Predicts There Will Be A Spot ETF

Suddenly, everyone and their mother are anticipating the approval of the ETF, almost as if a fake news story triggered a collective awakening to reality. In a recent interview with CNBC, Paul Grewal, Coinbase's chief legal officer, expressed optimism that the SEC will likely approve a Bitcoin ETF in the near future. As the ETF approaches, there may be a growing debate about whether it's detrimental to Coinbase, but I don't share this perspective. The ETF is poised to attract new money, it doesn’t undermine the demand from spot buyers.
“I think that, after the U.S. Court of Appeals made clear that the SEC could not reject these applications on an arbitrary or capricious basis, we’re going to see the commission fulfill its responsibilities. I’m quite confident of that. We think that other ETFs are going to be coming online soon enough as the SEC follows the law and is required to apply the law in a neutral way to the applications that are pending. I’m quite hopeful that these applications will be granted, if only because they should be granted under the law.”
Tom Emmer May Become Speaker Of The House

It seems like just yesterday that the crypto community was celebrating the presence of pro-crypto advocates in Congress. Since those days, there's now the potential for Tom Emmer, a staunch proponent of cryptocurrency, to be elected as the future Speaker of the House and currently serving as the House Majority Whip. At present, the interim House Speaker is Patrick McHenry, a prominent proponent of cryptocurrency. However, he has expressed reluctance to continue in the position and offers full support to Tom Emmer. This week, as the Republicans deliberate on their leader, more information should emerge. Currently, it appears there's a strong likelihood of a pro-crypto candidate being chosen.

Live From Formula 1: How To Build A Generational Crypto Brand | Haider Rafique, OKX
Join my convo with Haider Rafique, CMO at OKX, live from Formula1 Singapore as we discuss how OKX is building its brand.
My Recommended Platforms And Tools
Trading Alpha - Ready to trade like the pros? The best traders in crypto are relying on these indicators to make trades. Use code ‘2MonthsOff’ when visiting my link HERE.
OKX - Sign up for an OKX Trading Account then deposit & trade to unlock mystery box rewards of up to $60,000! Use my code HERE.
The Daily Close - Brand New Newsletter! Institutional grade indicators and data are delivered directly to your inbox every day, at the daily close. Trade like the big boys
Nord VPN - Get an exclusive NordVPN deal - 40% discount! It’s risk-free with Nord’s 30-day money-back guarantee. Protect your privacy.
NGRAVE - ZERO is the most secure and user-friendly hardware wallet. If you aren't happy with your current crypto wallet, look no further than the ZERO.
Twitter - I spend most of my time on Twitter, contributing to CryptoTownHall every weekday morning, sharing random charts, and responding to as many of you as I can.
YouTube - Home of the Wolf Of All Streets Podcast and daily livestreams. Market updates, charts, and analysis! Sit down, strap in, and get ready—we’re going deep
TheWolfOfAllStreets.io - The most comprehensive collection of everything I have going on. Plus over 100 blogs and other exclusive content.
The views and opinions expressed here are solely my own and should in no way be interpreted as financial advice. Every investment and trading move involves risk. You should conduct your own research when making a decision. I am not a financial advisor. Nothing contained in this e-mail constitutes or shall be construed as an offering of financial instruments or as investment advice or recommendations of an investment strategy or whether or not to "Buy," "Sell," or "Hold" an investment.