


The Wolf Den #74 - Trades, Lessons And News

Bitcoin Just Had Its Third Best Quarterly Close Ever
A great piece from my friend Jason Yanowitz at Blockworks. You can join their free newsletter as well!
After a tremendous gain of 158% in Q2 of 2019, Bitcoin had struggled to maintain its price. In the subsequent three quarters through Q1 of 2020, Bitcoin fell between 10-25% per quarter.
Then, aided by money printer go brrr and institutional buyers such as Paul Tudor Jones, Bitcoin went up 42% in Q2 2020.
Bitcoin closed the most recent quarter at $9,140, good for its third best quarterly close in history.
Why did this happen?
Q2 has always been a good one for Bitcoin.
Aside from Q2 2018 when Bitcoin fell 7%, the asset has gone up every Q2 since 2014.
On March 13, Bitcoin flash crashed down over 50% to around $5,000. By the start of Q2, it had risen to $6,500.
There are 3 main reasons why Bitcoin jumped 42% in Q2 2020.
The Bitcoin Halving: In April, Bitcoin’s price rose 34% as excitement over its 3rd halving loomed large. As a reminder, the Bitcoin halving, which took place on May 11, cut the Bitcoin reward in half from 12.5 Bitcoin to 6.25 Bitcoin
Investors Hedging Inflation: Just four days before the halving, famed hedge fund manager Paul Tudor Jones announced that he had bought Bitcoin. He told clients that Bitcoin reminds him of the role gold played in the 1970s, and that he bought as a hedge against the inflation he sees coming from central bank money-printing. He specifically stated “The best profit-maximizing strategy is to own the fastest horse. If I am forced to forecast, my bet is it will be Bitcoin.”
Individuals Bought Bitcoin with Printed Money: Remember in April when the government sent Americans $1,200? It turns out many of them actually bought Bitcoin with that (see the image posted below by Brian Armstrong, Coinbase CEO). Of course, this probably didn’t move the market too much, but people really are saving at an unprecedented rate. With the increase of Robinhood trading, it’s not unreasonable to think that many of these individuals are putting some of their excess capital into Bitcoin.
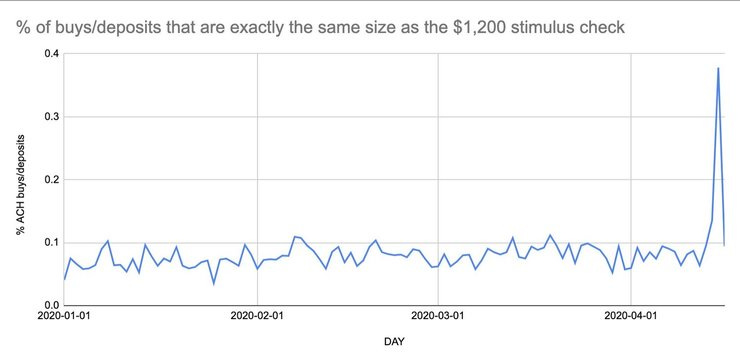
This chart is from Coinbase CEO Brian Armstrong showing how many Bitcoin buys were made with the exact size of the stimulus check. Source
What’s Next?
Third quarters have been historically challenging for bitcoin.
With the exception of Q3 2017 when Bitcoin’s price surged 80% and a small 3% gain in Q3 2018, Bitcoin’s price has remained in the red for the last seven years.
Predicting Bitcoin’s price in Q3 2020 is a fool’s errand, but here are some factors and models that could help.
Bitcoin transaction volumes and its 60-day moving average have been flat recently. This is usually a sign of calm times ahead
The stock-to-flow model points to a rapid increase in Bitcoin’s price in H2 2020
If the Fed continues to print money and the money continues to flow into individual’s checking accounts, Bitcoin will most likely increase in value
Here’s a December 2021 price prediction by more than 26,000 individuals
Bitcoin has struggled to break through and maintain a $10,000 price. It has broken through a few times but has never held for very long.
There are many ways to predict Bitcoin’s price, but remember, structurally, price can only go up when there is more demand to buy at a higher price than the desire to sell at a lower price. Price goes up with demand so lots of people coming into the space drives large upward price movements.
All time highs are driven by speculators, but the continued increasing value in annual lows is driven by non-speculators.
The Wolf Of All Streets Podcast Ft. Jack Tao

Jack Tao, CEO of Phemex began his career in high-level traditional finance before entering the crypto space. After 10 years with Morgan Stanley, he discovered bitcoin and crypto and set out to develop a superior exchange. Since Jack's recent arrival to the crypto space, his expertise in legacy markets has resulted in his trading platform's meteoric rise through the ranks, all while setting new trends around the ways traders pay fees and interact with derivatives.
Scott Melker and Jack Tao further discuss the transition from the traditional financial sector to a non-traditional sector, lessons learned interning at Morgan Stanley right before the 2008 crash, who is behind big price movement, the interactions between an exchange and a whale, how many Bitcoins it takes to be a whale, common misunderstandings around leveraged positions, the chaos of the American political climate and the origin of the name ‘Phemex.’
Bonds & Yields 101 & 102
From Sahil Bloom:
If you follow the financial news, you see and hear a lot of talk about bonds and bond yields. But what are they and how do they work?
Bonds are a debt funding instrument. The simplest way to think about a bond is that it is a loan given to a company or government by an investor. The entity borrowing money is said to “issue” a bond (i.e. put it up for sale). Investors “buy” the bond, providing a loan. As with any loan, the investor who purchased the bond is paid interest on the money they loaned and will receive its principal back on a set future date (“maturity date”).
The company or government that raised money can now use the funds to support operations or investment.
The perceived “default risk” of the borrower (i.e. the risk of the loan not being repaid) determines the interest rate investors will require as compensation for taking this risk.
This rate is called the “coupon” of the bond.
High Risk = High Coupon
Low Risk = Low Coupon
The bond “yield” is just the expected return of owning the bond.
Yield = Coupon Amount / Price
Simple Example: If I pay $1000 for a bond with a $100 annual coupon, that would be a 10% yield ($100 / $1000).
Bonds are tradeable instruments whose prices fluctuate in the open market due to various factors (issuer risk profile, interest rates). As such, bond yields are dynamic.
If I sell that same bond from above for $500, the yield to the new investor would be 20% ($100 / $500).
Bond prices move based on supply and demand. More demand increases the price of the bond, and thus drives down yield (and vice versa).
Yields ⬇️ = Demand ⬆️
Yields ⬆️ = Demand ⬇️
Why should you care? Well, we can learn a lot from the bond market. Treasury bond yields at historic lows? Investors are buying and flocking to safety... Hertz bond yields spiking? It may be in financial trouble...
That’s Bonds & Yields 101. Here's 102:
Let's talk about Yield to Maturity.
In Bonds & Yields 101, we covered the concept of Yield in its most basic form: Current Yield. Current Yield is just the return an investor would earn if she purchased a bond and held it for a year.
Current Yield = Annual Coupon / Price
Yield to Maturity ("YTM") is the annual return an investor would earn if she purchased a bond and held it until maturity (when the principal is paid back in full). At issuance, the Current Yield and Yield to Maturity are equal, but they deviate over time.
An example:
Say you buy a Hertz bond (don't do this!) that matures in 1 year and has a 10% coupon rate and a $1,000 par value. You pay $800 for the bond.
Current Yield = $100 / $800 = 12.5%
YTM = (Interest+Principal) / Price - 1
YTM = ($100+$1000) / $800 - 1
YTM = 37.5%
Note that the equation becomes more complicated when looking at longer maturities, as you have to discount the future cash flows. We can save that for another thread!
Now that we have the basics down, let's take a look at a very relevant (and weird) topic: negative yields. How do negative yields work? Let's slightly modify our example to illustrate.
You buy a US Treasury bond (safe!) that matures in 1 year and has a 1% coupon rate and a $1,000 par value. You pay $1,100 for the bond.
YTM = ($10+$1000) / $1,100 - 1
YTM = -8.2%
Negative yield!
So negative yields arise when an investor is receiving less money by holding the bond than they paid to purchase it.
An investor is PAYING for the right to loan money - weird!
Why might this happen?
Flight to safety
Central Bank "yield curve control"
Deflation risk
We will see more of this globally in the years to come (hint: buy gold!).
While far from comprehensive, I hope this was a helpful primer on the concept of Yield to Maturity and how negative yields may arise in this environment.
TradingView Adds Candlestick Patterns
This is REALLY cool, especially if you are a beginner and looking for extra eyes on the chart. Read the blog and check it out - you can now search for candlestick patterns automatically on TradingView!
Trading Horizontal Support And Resistance
I posted this video many moons ago from CryptoCred. It's really a great and quick lesson on how to identify and trade support and resistance levels. Everyone has their own strategy, so you can adapt the basic lessons here to work for you. Whether you draw lines on wicks, candle closes or line charts does not matter - it's how you use the information. This video is better than anything I will personally write up for you, and in a better format. Enjoy.
Bank of England Debating Digital Currency Creation
The world is going digital. Every single national currency will eventually be digital. Every person on the planet will become comfortable with the idea of having a wallet, sending and receiving digital currencies and more.
Once this grand awakening happens, do you think they will choose their centralized, trackable national currency that will tell the government every transaction you make, or do you think they will choose Bitcoin?
From the article:
The Bank of England is reviewing whether it should create a central bank-backed digital currency, according to governor Andrew Bailey.
“We are looking at the question of, should we create a Bank of England digital currency,” Bailey said Monday in a webinar event with students. “We’ll go on looking at it, as it does have huge implications on the nature of payments and society.”
“I think in a few years time, we will be heading toward some sort of digital currency,” he added.
The BOE is part of a group of major central banks teaming up to assess potentially developing their own digital currencies, acknowledging their role is being challenged by new technologies and private sector initiatives such as Facebook Inc.’s Libra.
It could be some time before the U.K. central bank is able to fully devote its attention to such a development, however.
“The digital currency issue will be a very big issue,” Bailey said. “I hope it is, because that means Covid will be behind us.”
Trading Tip - Start On Larger Time Frames

This is good advice. It's a known adage in trading that the less trades you take, the less chances you have to lose money. By zooming out and taking positions with wider stops and smaller position sizing, you give yourself a much greater margin of error. The trades will take longer to play out, forcing you to remain patient and avoid zooming in for more information. You will be in less trades that will require less babysitting or attention. This puts you in a position to be more successful.
COMP Hits A Billion In Loans
Wow. That was fast. DeFi continues to grow at a parabolic rate, which is part of the reason that I remain bullish on Ethereum and the space in general. This is newsworthy, but not much to discuss - just a sign of the times! Clearly Yield Farming is here to stay for a while.
My Recommended Platforms And Tools
Voyager
This is where I invest, commission-free. They now let you earn interest on your Bitcoin held in Voyager, so you can compound while trading. Not only that, you’ll get $25 in free BTC when you download & fund.
Rewards Code: Scott25
Phemex
This is where I trade with leverage and can also trade spot with no fees.
RoundlyX
I use RoundlyX to buy small amounts of Bitcoin every single day. They automatically round up my credit card purchases (with 10x multiplier) and invest them in crypto. Absolutely brilliant. Passively invest money you don’t need without a thought. Further, they have integrated with Voyager (see above) to offer commission-free purchases.
Rewards Code: WOLF
TexasWest Capital
This is where I spend my days teaching and learning! Our Discord group is a one stop shop for everything you need to learn to trade and control your emotions. Feel free to DM me on Twitter or respond to this email for questions.
Choice IRA by Kingdom Trust
Self-Directed IRA for Americans - allows you to invest in Bitcoin and any other asset for your retirement, with all of the tax benefits of a normal IRA.
Efani
Concierge Phone Service for Americans that protects your from SIM Swaps and other phone related hacks. I cannot stress enough how amazing this service is.
A new crypto rewards debit card that I have been testing and loving. I use both the virtual card online and the physical black card at actual retail (I will do this more after COVID!). They offer 6.38% cash back in crypto, which is really astounding.
BlockFi
BlockFI is where I personally store part of my long holdings. They offer up to 8.6% annually, compounding, depending on the asset (BTC, ETH or GUSD), which is much better than any legacy savings account or investment.
They are currently offering 2x interest for a month for new members.
Twitter
Follow me on Twitter at @scottmelker. This is where I am constantly updating my trades and sharing ideas.
Phemex
This newsletter is sponsored by Phemex, the only leverage exchange where I now trade.
Here are a few important points:
Institutional Background of the team - led by over 8 former Morgan Stanley Executives
6 Crypto trading pair + GOLD/USD
Phemex’s design criteria (<1ms latency speed, >300k tps, >99.9999% availability)
Sub-Accounts (Different from BitMEX and Bybit, allow to hold long and short positions at the same time, or lend accounts to fund managers)
USD settled contracts, less risky and simple PnL (Different from BitMEX and Bybit)
Proprietary Cold Wallet System
Traditional financial products soon, after licensing from MAS
Fund managing options (Up to 200 Sub-accounts, simplified withdrawals, full API integration)
Spot trading with no fees
New trading pairs added regularly.
SIGN UP HERE AND GET FREE BTC!
Voyager
Voyager is my favorite crypto broker. You can trade crypto fast and commission-free. Earn up to 6% interest on top coins with no lockups and no limits. You literally earn interest on your holdings while you trade at a rate higher than you can get in any legacy bank account or fund.
This is where I personally invest in Bitcoin on a daily basis. They are a publicly traded company on the Canadian Stock exchange and have FDIC insurance on USD holdings - I trust them implicitly to protect my funds.
They continue to add new trading pairs, have added 2FA of late and are pushing forward with improvements on a weekly basis.
Make sure to use code SCOTT25 when you signup to get free Bitcoin.
Bitcoin Thoughts And Analysis
Absolutely nothing has changed for Bitcoin. I could post effectively the same charts as I did last week and glean little new information. Sideways chop.
MONTHLY CHART
Nothing has changed since last week. We are in the same spot. This is what I wrote:
$9,243 continues to be the major story on the monthly chart. I have highlighted it in red, so that you can see how many candles have closed slightly above or below and have wicked through. This seems to be the most important area on the entire chart, as evidenced by the fact that the last 6 (now 7, for the moment) candles have closed at this line or had a wick that was stopped there. It’s incredible. Going back further, there were only two candles in the last 13 that did not interact with this area meaningfully. 12 of the last 15 candles have interacted with this line with either a close or wick as a clear top or bottom. That’s well over a year of price action that has effectively used this area as a magnet. We are presently there again, which is why I have little conviction about the next move.
WEEKLY CHART
We did see a spinning top confirmed 2 weeks ago with a green weekly candle last week. That is considered a signal that further price appreciation is likely. That said...
From last week: Bitcoin is trading sideways. Absolute chop. As I have said in a few newsletters now, going back more than a month, the two blue lines are what matter on this time frame. If price breaks above the top line and holds, that’s a long signal. If it breaks below the lower line and holds, a retest as resistance is a short. That would also likely signal a failure of the 50 MA on this time frame, which supported a number of candles in the past few months.
At the end of the day, we really want to see the break of $10,500 and a higher high. That’s where we can start to fell truly bullish again.
DAILY CHART
This is interesting. We have not really had a daily candle with a large wick on top in weeks. Wicks on top indicate strong selling. We have actually had a number of candles with long wicks down, which means that buyers are aggressively buying every single dip. That is bullish, as long as it continues. You can see that the last 5 days have all had wicks on the bottom. We want to see price rise sooner than later - eventually there will be nobody to buy those dips.
4-HOUR CHART
As it was last week, lower time frames look more bullish. You can see that price managed to "break out" of the big descending channel that everyone was watching, although it quickly fell back in. It now been consolidating against that resistance in another bull flag, which should lead to a break up. Should... does not mean it will. We want to see a really nice clean move about that local channel.
Altcoin Trades
I am trying to share a few less trades, as per feedback from members. Also, every chart that I have shared is still valid - alts have generally gone up and are still looking decent. You can always revisit the newsletters from previous weeks for more setups. POWR, ENG, HOT, BTT, HXRO etc. are all larger time frame trades that still look really good to me, just to name a very few.
ONT/BTC
This made a clear inverse head and shoulders, signaling a definitive bottom. I totally missed that when it happened - that retest of the blue line would have been a great trade.
The good news is that this has continued up and is currently breaking through a key level, also a supply zone. That's the blue box. I am now looking for a daily flip of this level as support, although it may not happen. If it does, it could take a while. I feel I missed the better entries below, but I do think this could easily continue to the higher targets shown by black lines. If you want to be a bit more aggressive, you could zoom into the 4 hour and take a retest if it happens.
PNT/BTC
This has been a really fun one to trade. I am looking for either a bounce off of that ascending support or a break of the descending black line to signal a trade on this pair. 8520 would be the target on a breakout, the top of the descending black line. I am fundamentally bullish on pNetwork and think that this will go much, much higher. As traders, let's take it level by level.
SXP/BTC
This is risky, as there is almost no price action. That said, I am always interested in trading a new coin on Binance, and this one is the coin for their own debit card.
At this point, I am watching for a break of the blue line, or a drop to 6850. That would be an awesome entry, if we can get it. The targets are in price discovery, so basically impossible to find. Again, a bit risky, and that blue line is brand new and could change.
XRP/BTC
XRP has been moving nicely, but was rejected at a key resistance level (2223). That said, the rejection has lead to clear consolidation in a bull flag. More often than not, consolidation below resistance leads to a break of that resistance. I would be targeting the 2500s on a break from the bull flag and above 2223. This would also lead to a break of the descending black resistance, would opens up the possibility of much higher targets.
Legacy Markets
BYND (BEYOND MEAT)
I have made a lot of money trading this stock, but it was off my radar on its meteoritic rise. I have shorted it this morning at $128.9. While the volume profile is not ideal, there is a head and shoulders on the daily, which broke down yesterday. I shorted the bounce to test the neckline as resistance. The target, based on the depth of the pattern, is shown. The more immediate target for me is the white line.
You can see with the red arrow I drew that volume has been majorly decreasing here on the way up, which is usually a sign of a reversal - volume and price action are not in agreement. That said, that reversal could have already happened on the initial drop, and that could be all we see. I have sized my position to allow for a bounce up to the supply zone shown - my stops are above that area. If price reaches there, I will likely add to the short, because the additional funds will improve my cost basis and will be very close to invalidation.
CODX (CO-DIAGNOSTICS)
This is another COVID play. The technicals seem to be lining up with the fundamentals, which is always a good sign that price is likely to appreciate.
I am waiting on a break of the descending blue resistance, if that happens. That is the proper trigger if you are looking to trade this stock. Targets are shown if that breakout happens. The 50 MA has been tested here as support a few times, I would not be surprised to see price dip below. I'm watching the blue line.
Here is some info on the company.
TSLA (TESLA)
Yes, I shorted Tesla again. While this may seem like a revenge trade, it truly is not. At the moment, the market looks weak and my thinking is that the stock that went the most parabolic is the most likely to suffer short term. The setup from before remains the same - I was just too early. The weekly chart above is too early to tell, but the potential overbought bear div is there, and the candle is presently hideous. That could change fast. That said, dropping down to the daily, yesterday's candle was also really ugly.
I am in from $1580 - I took the short right at the open. My stops are in profit.
More importantly, I have now made more on this short than I lost on the previous one.
The views and opinions expressed here are solely my own and should in no way be interpreted as financial advice. Every investment and trading move involves risk. You should conduct your own research when making a decision. I am not a financial advisor.