

The Wolf Den #7 - Thank You For Joining!

Bitcoin Charts And Analysis
BITCOIN IS SIDEWAYS! I can analyze the chart for you until I am blue in the face but there is VERY LITTLE to say. Bitcoin has been trading on low holiday liquidity, with nearly meaningless volume for weeks. Price is currently ranging - in my eyes there is no reason to trade or even watch the Bitcoin chart while it is trading in the current manner. This is a great time to zoom out and focus on larger time frames.
MONTHLY CHART
The monthly candle closed just above the 21 EMA, with a small body and somewhat long lower wick. This is more bullish than bearish, although not quite what I would consider a hammer. At the moment, the fresh monthly candle is resting exactly on the 21 EMA.


I shared an idea recently on Twitter that I think is very important and is an observation that I have not seen discussed elsewhere. As you can see in the chart above, the monthly candles had long upper wicks for 4 straight months, indicating strong selling and little resolve by bulls to push price up. This is a bearish sign, showing that bears are well in control of price on higher time frames. October showed a transition, with equal interest in buying and selling, indicated by the wick both up and down. The November and December candles have now closed with relatively small wicks on top and long wicks on the bottom. This is a sign that bulls are regaining interest and control, as they are buying up the dips. January will be an interesting month for Bitcoin traders, as it should give some clarity to direction. Regardless, there is plenty of action in this range.
Price remains trapped between 2 key levels of support and resistance. I sound like a broken record mentioning this every week, but this is the reality. A break above $7,777 would be quite bullish, while a drop below $6,540 would be bearish. That's the big story. Everything in between is sideways chop, and not ideal for longer term traders.
WEEKLY CHART
I shared this two weeks ago and wanted to make sure I mentioned that this bullish divergence with Stochastic RSI on the weekly chart confirmed. As mentioned, this is the fourth time that this has happened since the Bitcoin top (pictured above). The first moved price from $6,400 to $9,900, the second preceded the pump from $3,200 to $14,000 (!!!) and the third predicted the move from $7,400 to $10,400 just weeks ago.
Price is currently struggling to break above the EQ of the channel (dashed red line). A break above that line would the first sign of recovery.
DAILY CHART
From my mentor, Christopher Inks in Discord today. "What I find compelling at the moment is that the daily Stoch RSI has completely reset and almost bottomed out over the past couple of days while price has only dropped $200. When this happens on the daily, traders should be paying attention. Rather than a long, drawn out reset on the Stoch RSI as price notches 10%+ to the downside, what we have right now is very little downside movement but a hard and fast Stoch RSI reset."
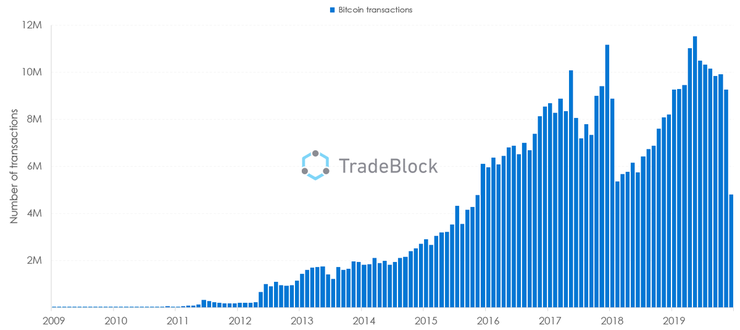
Bitcoin Went Up 9,000,000% In The Last 10 Years!
Insane. Absolutely mind blowing. Bitcoin was by far the most profitable asset of the 2010s (or whatever we are calling the past decade). It is hard to feel bearish long term when you read an article like this! Here are some more bullish developments for Bitcoin. The future seems bright.


Trading With Confidence
I toured Japan in 2006 with a famous Japanese singer named Toshi Kubota. It was his 20th anniversary tour - he had been on the road playing stadium shows for decades. Even with all of that experience, he still had terrible nerves before each and every show, often throwing up or nearly going into a panic before going on stage. He had a ritual to recenter himself - a set of affirmations and exercises to build his confidence for each show. He never made a single mistake in the 40+ shows that we played together. He was able to overcome his insecurities and build his confidence to succeed.
Confidence is the key to success in all facets of life. It is attractive to the opposite sex, noticeable to employers, motivating to your subordinates and intimidating to opponents. A part of being confident is believing that the best outcome is the most likely - it inherently eliminates negative thinking and allows you to tackle any obstacle in your path. You can "fake it till you make it" with daily reminders that you are talented, worthwhile and able. Eventually, you start to believe it and the confidence becomes real.
Confidence is particularly important when trading. The grounds on which you make your moves are always shaky and the only constant agent in investing is yourself. It is impossible to trade well if you are worried about losing - it is an expected and inevitable part of the game. Further, if you are not confident in a trade, you should not be taking it. The moment that your confidence in a setup falters, it is likely time to exit. Most importantly, you should never take a failure personally and let it bring you down.
A failure is a valuable asset because it gives you a lesson - if you track your failures, it will assure that you do not make the same mistake twice. The difference between a bad and good failure is the resolution to learn something from it and apply it to your future investments. When you learn from your losses, it gives you more confidence on upcoming trades.
Build your confidence and I guarantee you will see an improvement in your trading (and life).
Altcoin Trades
ADA/BTC - 12/27/19 ENTRY
ADA has been an interesting asset for me the past few weeks, so I thought I would share my current position. I took a position at 472 sats (red circle) - almost the DEAD TOP of the last move. I thought that there was an inverse head and shoulders (pink neckline was "confirmation") and that price was retesting this neckline, so I took a position and was completely faked out. Price dropped 2 candles later in epic fashion - likely a result of the closing of the Bitmex futures contracts on alts that day. I stopped out quickly at 467 sats on the drop. Small loss, but quick and brutal.
However, I was already looking for an entry at 447 sats, the blue line. My order filled on the drop and I remain in a position from that point. Price showed continuous bullish divergence with RSI and formed a bullish SFP, wicking below that blue line and then shooting back above. Clearly there was quite a bit of liquidity in this area. Even with the losing trade, I still remain in profit trading this pair as a result of good trade management and finding a better entry below.
ETH/BTC
I mentioned recently on Twitter that ETH looks a bit better to me than BTC. The larger range is the key (light blue). You can tell this is a meaningful range by the clear action around the EQ (dashed line). Blue lines are significant support and resistance and price reacted nicely to the lower one, hence why I think ETH looks decent.
The Ethereum 4 hour chart shows a clear bull flag, with price trading on the top half. The proper way to trade this would be to buy the breakout (or a retest of the top of the flag as support). A case could be made for a riskier entry here at the EQ of the channel (dashed line). Patient traders can wait for a move to the bottom of the flag, but that may never come,
FUEL/BTC
Lucky! As mentioned a week ago, I kept my stop loss in place and did not exit the trade, even though price had broken below the blue ascending support. Price danced 1 sat above my stop loss for roughly 10 days before popping back up yesterday. I am still in this trade from 38 sats. I am sharing this again to show why you stick to your plan!
FUN/BTC - UPDATE
FUN has been slow but positive. I remain long on this position, which looks like it is bouncing from horizontal and ascending support, as intended. My target is the top of the blue channel, which will take some time if it happens. Once again, patience is starting to pay off.
China Is Going Digital
China continues to take steps towards creating a state-backed digital currency, formalizing a law governing cryptographic password management. The crypto community has had bipolar feelings about China's push to be the first country to formally endorse and utilize a digital currency. On the surface, adoption seems like a positive, but the reality is that China will most likely continue to make moves against Bitcoin and other cryptocurrencies, which would likely be viewed as competitive to the central bank digital currency (CBDC). China's transition to digital currency is bullish for blockchain technology, but likely a less positive development for Bitcoin. That said, China has already effectively "banned" Bitcoin, so this is not much of a change in stance.
Below is a quick recap of China's policies towards crypto in 2019.
Finally, here is a great opinion piece from Bloomberg on the impact of a state-backed digital yuan. The importance of a centralized digital currency cannot be understated - read below to see why.
Get Rich Quick - Or Not
I stumbled across this article on Twitter and had a true "shake my head" moment. There are thousands of traders, many scammers, offering get rich quick schemes to uneducated followers - try this system, copy my trades, send me money and I will 10x it in 6 months etc. It should be obvious, but most Instagram accounts flashing cash and lambos are fake, with rented cars, borrowed pictures and fake jewelry. Most of the people running these accounts are amateurs, looking to score with your hard earned dollars rather than by trading.
There is NO SUCH THING as a "get rich quick" strategy in trading. The only way to truly make money is to develop a defined system, manage risk and be patient. If you are here for the Lambos, you will likely be sorely disappointed and even more likely to be selling your existing car to pay rent. The life of a trader is boring. As I stated above, it is a job like any other and should be treated as such.
Chart Requests
Below are the requests submitted to me by subscribers via email and Twitter DM. As always, altcoins are risky and these setups can be destroyed in the blink of an eye by a major Bitcoin move. The charts below are unbiased.
DOGE/BTC

Pictured above is the DOGE daily chart from October, when I personally entered a new trade on DOGE that I am still currently in. My entries were 23 and 28. As you can see, at the time there was strong bullish divergence with RSI and a break of descending resistance. Price his currently ranging - really nothing has happened at all, so there's very little to share.

A general note about DOGE- this coin has been my favorite and most profitable to trade over the years. It goes through massive cycles that have generally been easy to play, as long as you are patient and wait for the next move up. It looks due for another move - but past performance is not indicative of future results.
HOT/BTC
I have chosen to share the weekly chart, as I believe this gives us a great idea of the big picture on HOT. As you can see, price broke out of a large descending channel that it had been in since the all time high. That is bullish. However, the breakout was weak, both in terms of price action and volume. Since breaking that descending resistance, price has continued to move sideways in a trading range, between 7 and 13 sats. A break above 13 sats and retest as support would be the safest potential entry for a trade on this pair. A bounce off of 7 sats could also be a nice entry, albeit a bit more risky. Key levels of support and resistance for the entire chart are market with blue lines. Chart shared as of January 1st, 2020.
MANA/BTC
MANA looks good. There is hidden bullish divergence with RSI on the daily chart, a signal of likely bullish continuation. This confirmed yesterday and is shown by the red arrows. I actually took a position in this coin at 424 yesterday. Price also successfully retested a key support and resistance zone, shown by the grey box. My target is 508, stop loss below the ascending support line.
STORJ/BTC
STORJ is showing some signs of a bullish reversal on the daily chart. Price is currently ranging in the blue zone and is trading in the bottom half. This setup becomes far more bullish above the EQ (dashed line), which would also require a break of the descending resistance line shown on the right side of the chart. Price printed and confirmed a bullish divergence with RSI on the daily chart, in oversold territory. For me, this is a clear sign of a likely reversal. The real party would begin with a break of the blue range to the upside.
The views and opinions expressed here are solely my own and should in no way be interpreted as financial advice. Every investment and trading move involves risk. You should conduct your own research when making a decision. I am not a financial advisor.