


The Wolf Den #69 - Correlation, RSI Divs, Bitcoin And More

Bitcoin Thoughts And Analysis
I have been scalping Bitcoin longs for the past few days with great success. I entered first around $8,926 then again at $9,030 yesterday. I sold some on the way up, added some more on the little dip today. It's been a lot of fun, but Bitcoin still looks like it could go either way on any meaningful time frame. There's been no reason to trade Bitcoin for week if you have a larger time frame view, unless you shorted near the top - alts were where you wanted to be until very recently.
Honestly, larger time frames look like further downside is likely to me, while shorter time frames look more bullish for smaller moves up. This is from an objective reading of the charts - no real bias. That said, it should be clear that nothing looks "bearish" to me from a long term perspective. We could go down really far without changing anything major for Bitcoin's future price projections.
MONTHLY CHART
The monthly candle closes today, so it's finally worth watching this time frame with an eagle eye. Bulls want to see a monthly close above $9,243, a level that was broken last month but has failed thus far to hold as support. It's very much a possibility for price to close near or above. Other key levels are marked.
There is potential bearish divergence on the MONTHLY BTC chart, which is a really negative signal. Bulls want to change this before the month closes tonight, if possible. You can see that the last confirmed bear div came before the epic drop to the $3000s. This is a continuation of that bear div. At the moment, the elbow on RSI is not definitive, so anything closing above current price could really make it an unclear and less valid signal. Bulls have work to do today.
WEEKLY CHART
I feel like I am banging my head against the wall repetitively having to look at Bitcoin on these larger time frames for you guys a few times a week. As I have said before, on the weekly price is totally sideways. The blue lines are the key - a break below the bottom one is bearish and above the top one is bullish. At the end of the day, we need to see $10500 broken to make a higher high and end the bear case. The 50 MA here is turning slightly down, which is a slightly negative sign. It has held a few times, but not sure it would manage another test.
We had bearish divergence confirm on the weekly a few weeks ago at the recent top. Not great, because it looks like it could have more to give. A monthly bear div in confluence with this would be a bearish signal.
DAILY CHART
Not much to like on the daily chart. Price was rejected again at the bottom of the ascending wedge, still the dominant pattern on this chart. Price is also trading below the 50 MA and broke down from the key black line that I was watching as support here. I STILL have orders in the blue zone below, because it would STILL be a bullish breaker if price dropped down there to retest it. This looks like like it could retest the black line at $9270, the 50 MA just above that, or even the upper black line at $9552 without really turning bullish. It needs to break the descending blue line to start to look better on this time frame. For me, the story is the clear rejection from the wedge bottom.
4-HOUR CHART
Better news on lower time frames. The 4 hour has a clear inverse head and shoulders (I pointed this out in advance on Twitter) that has been retested as support. The target is extrapolated by measuring from the highest point to the lower and then measuring it from the breakout. That puts it somewhere in the $9600s, although these rarely hit their targets. The volume profile is correct, with spike in both the left shoulder and head, as well as on the breakout and retest. Still, as bullish as this is, it only gets price back to the $9600s.
This chart looks good to me - as I said, better on lower time frames. On Thursdays, I pointed out the bottom of that purple range with a green circle, which is why I took a long. Price did exactly what I mentioned I was looking for - a wick below the range to find liquidity before a move up. Here is what I said on Thursday...
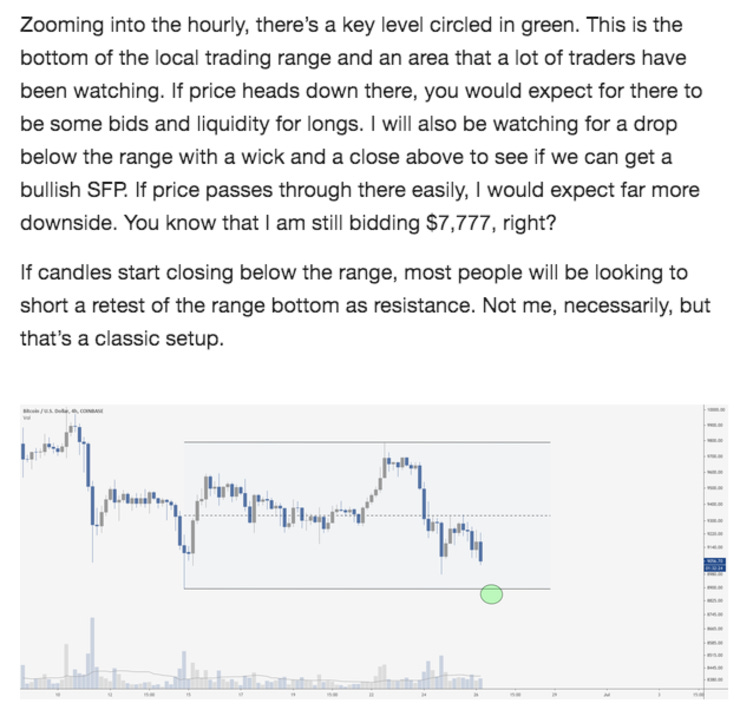
Price formed a beautiful green descending channel from that point, then a bull flag at the top of the channel against resistance. It popped up from there. Today's dip retested the green zone perfectly as support. Really beautiful TA. $9189 is now the key resistance on this time frame. Breaking that should send price to the EQ of the purple range.
The huge descending blue channel lines up with the blue resistance line on the daily. Ultimately, breaking that would be the signal that we have turned bullish. That said, price can go down to the bottom of this blue channel and still be "bullish." That could be the low $8000s or high $7000s before reversing back up to test a breakout. So keep that in mind.
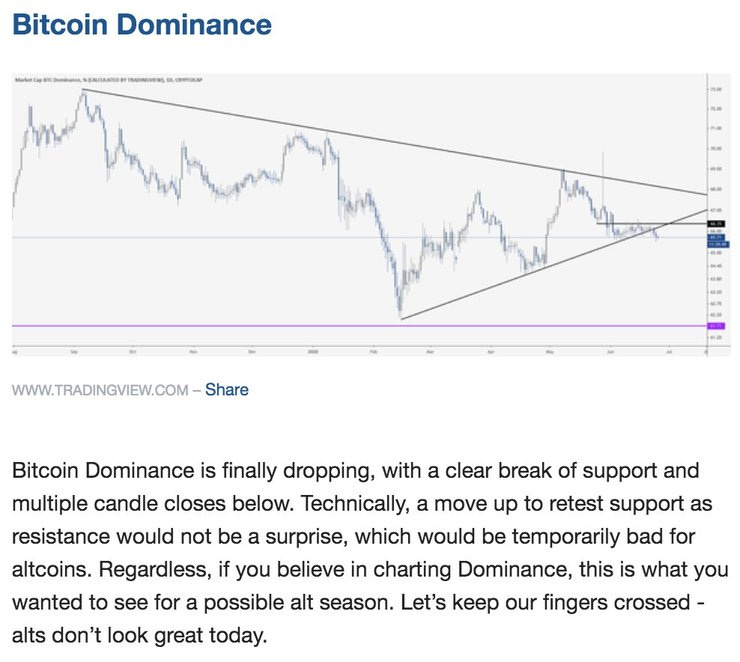
Bitcoin Dominance Retest And Alt Season
As you know, Bitcoin Dominance finally broke support. As you can see below, I said that it was likely to come back up and retest that support as resistance. That has finally happened, which is clear on the chart above and was indeed bad for altcoins short term.
This "should" continue to head down, but charting Dominance can often be a frustrating pursuit. At the most basic level, if Dominance is dropping, altcoins should do well. If it's rising, they should suffer. You don't need lines on a chart to understand this.
Pantera Capital, once of the most notable hedge funds in crypto, has noticed the same thing. In their June 2020 Blockchain letter, they predict that altcoins will outperform Bitcoin for the remainder of 2020 and into 2021. I generally agree with this assessment.
When taking alt positions, keep this in mind! It's going to likely be more profitable to take smaller positions on larger time frames, giving alts a chance to move freely and trend up. Let's keep our fingers crossed and remain patient.
The Wolf Of All Streets Podcast Ft. Daniel Gouldman

Daniel Gouldman, Founder and CEO of Ternio, started his early career living out of a car and climbing the Blockbuster corporate ladder. He eventually had millions under management, but chose to risk it all to start his own blockchain payments company. From sleeping in fields to becoming a massively successful crypto entrepreneur, his lessons learned will hit home with everyone.
Daniel and I further discuss treating each dollar like it's your very last, growing up as a Blockbuster kid, being wary of Bitcoin’s false prophets, how to live out of a car, tokenomics of utility tokens, work life harmony, making friends around the world, the most convenient crypto card on the market and more.
Sponsored by:
RoundlyX allows you to dollar-cost-average into crypto with our spare change "Roundup" investing tool, manage multiple crypto exchange accounts in one dashboard and access curated digital asset content and services. Visit RoundlyX and use promo code "WOLF" to learn more about accumulating your favorite digital assets when making everyday purchases and earn $4 in free Bitcoin.
---
This episode is brought to you by Voyager, your new favorite crypto broker. Trade crypto fast and commission-free the easy way. Earn up to 6% interest on top coins with no lockups and no limits. Download the Voyager app and use code “SCOTT25” to get $25 in free Bitcoin when you create your account
The Dollar (DXY) And Bitcoin
The dollar is presently in an interesting spot, with price movement hard to predict moving forward. As you can see, DXY has been in a beautiful ascending channel since the financial crisis in 2009, which has been the dominant macro pattern. The key areas that I am watching are in purple and the immediate downtrend since that started in early March is shown by the descending black line. A break of that line would signal further dollar bullishness. A break below or above the purple zones would also signal further bullishness or bearishness.
Losing the macro ascending channel would be very bearish for DXY, but even a move to test the bottom of the channel could be very good for Bitcoin.
Inverse correlation on full display. As I said in the intro, these two assets have had huge gaps between them at their most pivotal moments. Bitcoin's all time high coincides almost exactly with DXY's multi year lows. DXYs local high in March was nearly the same day as Bitcoin's huge crash to the $3000s. This is circled in green on the top DXY chart and also coincides with a failed test by DXY of the EQ of the huge descending channel.
This is a FAR MORE COMPELLING comparison than looking at Bitcoin Vs. the stock market. Keeping an eye on the dollar is likely to help us discern where Bitcoin is headed.
RSI And Divergences 101 - The Basics
This is a reprint from an old issue. I am sharing it again because it is a core part of my strategy!
If you have been following me for a while, then you know that my single favorite strategy for identifying trading opportunities is bullish and bearish divergences. In my case, I primarily use RSI, but the strategy is the same regardless of indicator. This is a very basic first guide on RSI and divergence basics - I will expand upon it in future issues.
Here is a basic cheat sheet for identifying divergences. Today we will focus on regular (or standard) divergences.

What is RSI?
RSI stands for Relative Strength Index. It’s a momentum indicator, which means that it measures the speed (or strength) of the movement of a price. More specifically, it compares the magnitude of recent gains and losses over a specific time period. That time period is usually configurable and you’ll see that a popular period is 14, meaning that it will use the last 14 candles in the calculation.
All of this is normalized to a scale of 0 to 100. So if the RSI indicator is closer to the lower end (let’s say 20), this means that the price has been in a downtrend for a while now and is in the oversold area. However, if the RSI indicator measures closer to the higher end (for example 80), it signifies that the price has been in an uptrend for a while and is in the overbought area.
You have probably heard the following strategy for RSI many times - it is unreliable!
If the RSI indicator is greater than 70, the price is overbought and you should sell.
If the RSI indicator is below 30, the price is oversold and you should buy.
Price can keep going up, long after the RSI indicator showed a value larger than 70. And the price can keep going down for a long time after the RSI measured a value lower than 30. Simply put, RSI overbought and oversold regions are not reliable signals to go long or short.
***It should be noted that traders expect RSI to travel to overbought once it is oversold and to oversold once it is overbought, although there is no specific indication of how long this will take.
Enter Divergence!
A regular RSI divergence (not hidden) is when the price makes higher highs in an uptrend and the RSI indicator makes lower highs. Or in the other direction: when the price makes lower lows in a downtrend and the RSI indicator makes higher lows.
Remember that the RSI indicator is a momentum or strength indicator. As long as the price and the RSI indicator line up, we can say that the current trend or price move is showing momentum in a specific direction. But once we see the price and the RSI indicator diverge, this momentum is fading. RSI divergence indicates that the current trend is losing strength. RSI divergence shows us that the current trend is losing momentum and the conditions are setting up for a trend reversal. These are the early stages of a momentum shift, and that’s exactly what we’re looking for as reversal traders. They are by far the most powerful in overbought and oversold territory.
Drawing Divergences
There are a couple of things you need to keep in mind when drawing divergences. During an uptrend, you connect the highs (and not the lows!) in order to detect a divergence. At the same time, we connect the highs and not the lows of the RSI indicator. These highs and lows must coincide - you have to compare the exact same date or time on price as on RSI.On the other hand, if we are in a downtrend, we need to connect the lows (not the highs) of a price trend and the lows of the RSI indicator as well.
Using A Line Chart
Divergences can be confusing on a candle chart, because traders often argue as to whether they should use wicks or real candle bodies. Using a line chart, rather than a candle chart, can eliminate the noise. Line charts are calculated solely on candle closes, so they give a stronger divergence signal.
How To Trade It
There are numerous strategies for trading with RSI. I prefer to take a position when the divergence is confirmed - when I see the defined “elbow” on RSI after a candle close. It is important to watch for a divergence on the other side (hidden bearish or bearish divergence) to indicate that the div has completed or is invalidated. I will sometimes take a position before confirmation if the div looks very likely to confirm, but this is very risky and not recommended until you are very comfortable identifying these opportunities.
Bitcoin Daily Divs Since All Time High
This is a quick chart that I just drew up of daily divergences with RSI on the Bitcoin chart since the all time high. I may have missed some. This DOES NOT INCLUDE HIDDEN DIVERGENCES, which have also been very powerful. Nearly every top and bottom for the past few years has been preceded by an overbought or oversold divergence. This is the case on almost any chart of any asset that you look at.
Here is the monthly chart for the SPY (tracks the US stock market). You can see that there have been 2 major bearish divergences with overbought RSI. One preceded the market correction of late 2018. The other confirmed in February of this year - and we all know what is happening to that market!
The Bottom Line - The Quick Notes
Divergences with RSI are a powerful tool for identifying likely price reversals
They are most powerful when they occur in overbought and oversold territory
They have been present at nearly all Bitcoin tops and bottoms
It is essential that you compare the exact same points on RSI and price
A divergence is confirmed when RSI makes a definitive move in the opposing direction, creating an elbow or point worthy of comparing to price
Traders expect RSI to travel to overbought once it is oversold and to oversold once it is overbought
They work best in confluence with clear chart patterns and candle structures - like the January shooting star on the SPY chart above
RSI divergences are not a magic formula - no indicator or strategy is correct all of the time. However, if used correctly, they can provide you with valuable information about the momentum of the current trend and the possibility of a future trend reversal. It’s especially interesting for reversal traders and early trend traders since a lot of their trading strategy revolve around correctly detecting a shift in trend direction.
Check Your Bias At The Door

Anyone who has been trading for more than a few months can likely admit to the behavior described above by Peter Brandt. Technical analysis is not an exact science. I would argue that it's not a science at all, but is more of an art form - the beauty or effectiveness of a chart is in the eye of the beholder.
TA is a risk management tool - you should attempt to open a chart with no bias, draw your lines and patterns, identify your areas of interest and close the chart. If you execute a trade, you should NEVER go back and draw new ideas on the chart. The trade is as good as finished the minute you take it, because you have a stop loss and target already set. The only change you should make is to move a stop loss up to lock in profit when appropriate. You should never move a stop loss down.
Revisiting a chart when a trade is active is an inherently biased activity - you are looking for more information to justify your position. "If I just move my stop down a bit more below support, it should bounce." "My target should be higher, there's another resistance that price should reach."
These are just forms of fear and greed.
Be honest with yourself - do you change your view on a chart based on your bias and try to convince yourself that something is suddenly different?
If so, stop!
Metals
XAG (SILVER)
Beautiful chart. We have been trading this here since around $14. The last monthly candle broke above the EQ of the range, with June testing it as support. A break above the key resistance around $18 should send price to the top of the green range. If it breaks above, the key levels are marked. At this point, the safe entry if you are looking for one is a break above that $18 level and retest as support.
XAU (GOLD)
I have been sharing gold longs here since price was in the $1500s, which is where I entered on the retest of that ascending channel as support. If price can manage to break through this massive monthly supply zone, then it should be headed for price discovery and new all time highs.
There's room for Bitcoin and gold in your portfolio, people. They are not enemies, they are more similar than different. Best entries now would be a retest of the range EQ (dashed line) as support on the monthly, or a break of the top of that entire zone and retest as support.
Hedge Funds Are Covering Shorts
Quite an article. Hedge funds are trying to get out of their shorts, even as it appears the market is poised for another drop. They went in so heavily that they are being forced to cover, regardless of what they think may come next. It seems they are terrified of being on the wrong side of another market rally, as they have been for the past few months.
"Fast-money hedge funds are rushing to cover their bearish U.S. stock bets even as the equity rally threatens to break down. Speculative investors bought a net 206,227 S&P 500 Index E-mini contracts in the week to June 23, the most since 2007, according to the latest Commodity Futures Trading Commission data. Net short positions in the contracts were at their highest in almost a decade as the U.S. equity rebound pushed the benchmark back toward record territory."
MortgageBee App
I invested in the crowdfunding campaign for Bee Mortgage App. Bee is using blockchain to create a fully automated mobile mortgage experience for the flood of new home buyers entering the market today. Millennials make up the largest home buying segment this year and that number will grow. These mobile reliant consumers are driving mobile adoption for all things including banking and car and stock buying. With typical lenders having acquisition costs around $8,000, Bee's proprietary automation aims to reduce that down to as little as $2,700. As the mortgage industry has yet to be disrupted by mobile, the team's thesis is whoever owns the mobile purchase market owns the future of lending.
Launched by mortgage and real estate pros for home buyers, Bee hit key milestones quickly: they released their Android MVP in May, are generating revenue, and have a successful pre-seed crowdfunding round under their belt which ends today. Along with two pending patents on their technology and a partnership with Florida Capital Bank, Bee Mortgage App is well positioned to capture the mobile home buyer who wants to avoid dealing with the bank. For those looking to participate with me in the crowdfund, click here.
Financial Lessons Learned From Covid-19
This is an interesting article in Forbes, which basically asserts that "once in a lifetime" events like Covid are actually far more frequent and planning for them should always be a part of your risk management strategy. According to this article, there is a high probability that something bad will happen every 10-15 years, so it's essential to have a well diversified portfolio which includes cash.
Risk management is everything!
"It can be fun for a time to ignore the potential for such events and leverage the good times to maximize gains, but the gains are ephemeral when there’s no plan for the potential bad times. The specifics of the coronavirus pandemic weren’t predictable. But it was foreseeable that at some point there would be at least one global event that would disrupt trade and transportation and bring at least parts of the economy to a halt. One could imagine fighting wars, trade wars, political conflicts that lead to sanctions and others.
Each of these events has a low probability of occurring. But when the probability of each individual event are added, there’s a high probability that sometime very bad will happen every 10 to 15 years.
It’s safer to assume a bad, unpredictable event such as Covid-19 is in the near future. That doesn’t mean putting all your portfolio in cash. But it does mean ensuring each of your investments has a margin of safety and that you manage risk in your portfolio. I recommend that no matter what your outlook for the markets you always have adequate diversification and balance in your portfolio. You always want different investments in your portfolio so that a portion of the portfolio will do well in almost any economic and market environment.
It’s a safe bet that one of these rare events that has high costs and low probabilities will occur every 10 to 15 years. We need to be prepared to experience a “once-in-a-lifetime event” with some regularity."
My Recommended Platforms And Tools
Voyager
This is where I invest, commission-free. They now let you earn interest on your Bitcoin held in Voyager, so you can compound while trading. Not only that, you’ll get $25 in free BTC when you download & fund.
Rewards Code: Scott25
Phemex
This is where I trade with leverage and can also trade spot with no fees.
RoundlyX
I use RoundlyX to buy small amounts of Bitcoin every single day. They automatically round up my credit card purchases (with 10x multiplier) and invest them in crypto. Absolutely brilliant. Passively invest money you don’t need without a thought. Further, they have integrated with Voyager (see above) to offer commission-free purchases.
Rewards Code: WOLF
TexasWest Capital
This is where I spend my days teaching and learning! Our Discord group is a one stop shop for everything you need to learn to trade and control your emotions. Feel free to DM me on Twitter or respond to this email for questions.
Choice IRA by Kingdom Trust
Self-Directed IRA for Americans - allows you to invest in Bitcoin and any other asset for your retirement, with all of the tax benefits of a normal IRA.
Efani
Concierge Phone Service for Americans that protects your from SIM Swaps and other phone related hacks. I cannot stress enough how amazing this service is.
A new crypto rewards debit card that I have been testing and loving. I use both the virtual card online and the physical black card at actual retail (I will do this more after COVID!). They offer 6.38% cash back in crypto, which is really astounding.
BlockFi
BlockFI is where I personally store part of my long holdings. They offer up to 8.6% annually, compounding, depending on the asset (BTC, ETH or GUSD), which is much better than any legacy savings account or investment.
Twitter
Follow me on Twitter at @scottmelker. This is where I am constantly updating my trades and sharing ideas.
Phemex - The Fastest Growing Derivatives Exchange
This newsletter is sponsored by Phemex, the only leverage exchange where I now trade. I have been offered the opportunity to work with almost every exchange in the space, and held off for years on choosing to endorse one. It was a huge decision for me to start trading and publicly sharing Phemex with my followers and have been nothing but impressed with my experience.
Here are a few important points:
Institutional Background of the team - led by over 8 former Morgan Stanley Executives
6 Crypto trading pair + GOLD/USD
Phemex’s design criteria (<1ms latency speed, >300k tps, >99.9999% availability)
Sub-Accounts (Different from BitMEX and Bybit, allow to hold long and short positions at the same time, or lend accounts to fund managers)
USD settled contracts, less risky and simple PnL (Different from BitMEX and Bybit)
Proprietary Cold Wallet System
3 Withdrawals per day (Different from BitMEX)
Traditional financial products soon, after licensing from MAS
New pairs coming soon
Fund managing options (Up to 200 Sub-accounts, simplified withdrawals, full API integration)
No fee spot trading
SIGN UP HERE AND GET FREE BTC!
Voyager Adds 2FA and COMP
Voyager has a lot happening right now! They finally have 2FA coming out this week and released COMP token on Friday! More big news is in the pipeline for the coming weeks.
Voyager is my favorite crypto broker. You can trade crypto fast and commission-free. Earn up to 6% interest on top coins with no lockups and no limits. You literally earn interest on your holdings while you trade at a rate higher than you can get in any legacy bank account or fund.
This is where I personally invest in Bitcoin on a daily basis. They are a publicly traded company on the Canadian Stock exchange - I trust them implicitly to protect my funds.
More importantly? USD held on Voyager is now FDIC insured!
Use code SCOTT25 when you download the app to get $25 in free Bitcoin when you fund your account.
The views and opinions expressed here are solely my own and should in no way be interpreted as financial advice. Every investment and trading move involves risk. You should conduct your own research when making a decision. I am not a financial advisor.