

The Wolf Den #5 - Expanded Paid Version Next Week! Subscribe TODAY!

Bitcoin Charts And Analysis
I entered a Bitcoin position last week with an average entry of $6,550. I exited for another successful trade, with an average selling price of roughly $7,300 for an 11.4% gain. This was a big win, as I entered with a larger than normal position. The entire thought process of the trade is laid out clearly in a series of tweets, linked below. Click on the chart image to see the entire thread. I am currently long once again with an average entry of $7,210.


MONTHLY CHART
The monthly chart remains key for seeing the bigger picture on Bitcoin. As I have discussed for weeks, price is trading between two key levels of support and resistance on this time frame - $7,777 and $6,540. This candle has another 5 days until it closes, so it is unwise to draw conclusions at the present time. That said, if price appreciates further in the coming days, the monthly could close as a bullish hammer (I discuss this concept below with regards to the previous weekly candle), which would be a sign that the bottom is likely in and price is ready to continue up.
Notably, price is presently (again, candle not closed) trading above the 21 EMA, which has become largely significant to the crypto community. I can not speak to the importance of this EMA, as it is not one that I have watched or heard of previously, and "21" seems somewhat arbitrary to me. However, the reason we look at charts is to determine what other traders are likely to do - if they are watching this line, then it's worth paying attention to. As with any support and resistance, a candle close above the line would lean bullish, with a close below the line being more bearish.
WEEKLY CHART
Price remains in the descending channel that it has been trading in since the $14,000 top. As discussed in the Twitter thread above, Price formed a bullish Swing Failure Pattern (SFP) on the daily chart, which is also clear here on the weekly. The slight wick below the previous swing low is a bullish indicator, and a sign that the large operators (whales) in the market pushed price down to this point to fill their bids. This is often referred to as a "stop hunt."
At present, price is struggling with the equilibrium (EQ) of the descending channel. This center line is a common level of support and resistance. A move above that line should signal further movement to the upper channel resistance.
LAST WEEKLY CANDLE ANALYSIS
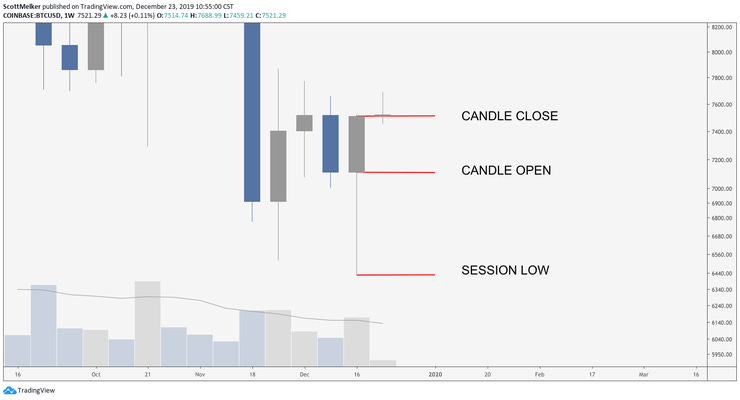
The last weekly candle was exceptionally bullish. Most traders would identify this candle as a bullish hammer - a candlestick with a long lower wick (or shadow) with a solid real candle body on top. I discussed this kind of candle in last week's newsletter. There can be some debate, as the real body on top is larger than the classic hammer - but there can be no argument as to the sentiment indicated by this candlestick.
What does this candle tell us about last week's price action? Price opened at the low of the previous candle. During the session (in this case a week), bears pushed price all of the way down to roughly $6,400. At that point, this candle looked exceptionally bearish - that is why we wait for candles to close to analyze them. Bulls took over the action - not only did they buy up the entire dip, they managed to continue buying past the candle open to close the week $400 higher than the open. This tells us that bulls are in control and that there is tremendous demand and buying power around the current price.
That said, a conservative trader waits for confirmation from the next candle before opening a trade. Their eyes are on the current weekly candle - if it closes green, it is statistically highly likely that Bitcoin has bottomed and will continue up.
4 HOUR CHART
The 4 hour chart shows us everything that we need to know about what is happening with Bitcoin in the short term. For me, the blue line at $7,870 on top is the most important on the chart - breaking this line would confirm a double bottom , which is a reversal pattern. This would also indicate a break of the local trading range (shaded blue) that price has been in since the slow bleed from over $10,000. Price is currently holding the equilibrium (EQ) of the channel, the dashed center line. Holding this as support should lead to a test of the channel top. Closing candles below it and flipping it to resistance should indicate another trip to the bottom of the range.
Side note on double bottoms - they are NOT CONFIRMED until the swing high between the two bottoms is broken. Never listen to anyone who calls something a double bottom before this has happened. Two equal bottoms alone are meaningless with regards to this pattern.
CME GAPS
Much has been made of the gaps that often occur on the CME (Chicago Mercantile Exchange) futures Bitcoin charts. Traders have been using gaps in their analysis in legacy markets for ages - since most markets close on weekends and at night, it is not uncommon for price to create these gaps when news occurs after hours when the market is closed. "Nature abhors a vacuum," so traders look for these gaps to be filled by price.
Gaps are less common on crypto charts, as the market never closes - most candles open at the same price as the close of the previous candle. That said, the CME does not trade on the weekend, which often leaves gaps on the chart when trading commences after the weekend. This Monday was no exception, leaving a gap up on the daily chart. This gap filled (like most do) in a matter of days.
I personally do not feel that crafting a trading strategy strictly around CME gaps is beneficial - in a market that trades 24/7, it's obvious that an exchange that closes for the weekend while trading continues elsewhere will likely have gaps on the chart. Price would have to remain sideways for the entirety of the weekend to avoid this. However, it is a tool worth keeping in your arsenal - when in confluence with your other analysis, it has a high hit rate.
Here is a great thread, summarizing the data on CME gaps and how to approach them with regard to trading.

Final note - there is a significant gap that remains unfilled at around $11,700.
Altcoin Trades
As predicted last week, alts have remained shaky and difficult to trade. Bitcoin is choppy and showing no clear sign of direction and traders are off for the holidays. There's very little action.
In the past week, I managed a 12.6% position gain on the IOST trade that I shared previously, closing it at the target of 80 sats. The KNC trade I posted last week took about an hour to invalidate and hit my stop loss. As I said last week "my stop loss here is tighter than 80s basketball shorts - just below 3500." This amounted to a 2.4% loss on the position - negligible with regards to my portfolio. Once again, I managed to keep my loss very small.
NOTE - all of the trades below have smaller than normal position size. My risk on these is roughly .25-.5% of my portfolio if my stop loss fires.
XVG/BTC
I entered a trade on XVG/BTC today, on the touch of support at 49 sats. My target is the resistance at 63 sats and my stop loss is at 46 sats, guaranteeing a tiny loss if this goes the wrong way. I will be actively managing this trade based on market conditions and am likely to exit more quickly than normal.
FUN/BTC (AGAIN!)
As discussed in last week's newsletter, I was looking to reenter FUN once again at 44 sats. I had the order set and it filled in the past few days. This is still very straightforward - a candle close below the blue ascending channel would serve as invalidation. My stop is presently sitting at 40 sats. My target is the top of the channel.
FUEL/BTC - 12/20 Entry
I entered FUEL last week on the bounce off of the blue support line at 38 sats. As simple and straightforward as they come. Price broke below this line, but still has failed to trigger my stop loss. It has been dancing 1 sat above my stop at 35 sats for a few days. While the trade has been invalidated by the break below the line, I have kept my stop loss in place and the trade active for now. I am watching for a break back above the blue line.
LunarCRUSH - Community-Driven Crypto Insights
Unlike traditional stock markets, cryptocurrencies do not have earnings reports, management or borders. In order to identify value you must access the community building around a project. A crypto project's community consists of two main parties; builders and users. Within the user demographic, you also have socializers and integrators. The faster the socializer and integrator network grows, the more value the network has. LunarCRUSH captures the socialization value of all cryptocurrency networks and maps that adoption over time.
Social Listening
LunarCRUSH has been tracking social engagement on a number of projects over the last 2 months. Social engagement is a measure of ALL or TOTAL activity across all channels for cryptocurrency mentions (think total mentions, comments, retweets, likes, upvotes, urls, news). Social engagement is very difficult to game or spam making it a true indicator for price action that an investor should pay attention to.
Influencers
News was meant to be unbiased. Major news outlets have become less and less objective in their reporting. This has driven consumers to find news in new places. Many have moved to ingesting data and information from influencers, as they want to know the person behind the ideas. LunarCRUSH has released version 1 of their influencer tool to help customers understand this important aspect of the market.
Social Listening Example - Basic Attention Token (BAT)
LunarCrush picked up a massive spike in social engagement a couple of hours before prices started to take off. Socializers in their community from across the web started talking about grumblings of a new 1.0 version. They were finally coming out of beta. LunarCRUSH and their social listening tool picked this up.

Give them a follow on Twitter and check out their site. There is a ton of unique and valuable data available.
5 Bearish Candlestick Patterns
Last week we discussed bullish candlestick patterns, so it's only right to follow up with 5 bearish patterns that every trader should know. It is important to note, once again, that context and candle placement are essential in identifying patterns.
The same exact candlestick can be bullish when located in a different place on the chart.

The Bearish Harami is a two candle pattern that signals a likely reversal in price. In this pattern, the first candle is large and green and is followed by a red candle with a smaller body.
To be valid, the second candle must be completely within the range of the body of the first candle. Another notable version of this pattern is the Bearish Harami Cross, where the second candle is a perfect doji.
In Japanese, the term “Harami” is the word for pregnant. In this pattern, the green candlestick is the “mother” and the small candlestick is the “baby.”

Price action following this pattern is often as ominous as its name, Dark Cloud Cover. This is another 2 candle pattern that signals a likely bearish reversal at the top of a bullish movement. The first candle is generally large, always green, and is followed by a similar red candle.
The second candle opens with a gap up to a fresh high but closes the session more than halfway into the body of the first day’s candle. This is a signal that bears have dominated the session, pushing the price down with the intention of following through on future candles.

The Evening Star is a bearish reversal pattern that appears at the top of an uptrend with a large bullish candle, followed by a gap up to a small-bodied candle and a gap down to a red candle that closes below the midpoint of the first day.
The first candlestick in the evening star must be green and have a relatively large real body. The second candlestick is the star, which has a short real body that does not touch the real body of the first candle — it is the gap between the real bodies of the two candlesticks that makes a doji or a spinning top qualify as an evening star.
This pattern is confirmed by the candlestick that follows the star, which must be a red candle that closes well into the body of the first candlestick.
In legacy markets, there must be gaps between each of the candles. However, since crypto trades 24/7 and gaps are rare, some technical analysts argue that this pattern is still valid without the gaps.

Similar to the previously discussed patterns, the shooting star is a bearish reversal pattern. This two candle pattern appears during an uptrend and signals an upcoming reversal to a bearish bias.
The first candle is green, followed by a green or red candle that has a long upper wick and small body. The second candle looks like an inverted hammer, which is bullish when located at the bottom of a trend.
The long wick as an indication that bulls controlled much of the session, before losing ground to bears, who pushed the price back down to close near the daily open. This is a signal that price depreciation is likely and is confirmed when followed by a bearish candle.
Note - the image above (I did not draw it!) is not an ideal shooting star - the upper wick or shady should be much longer.
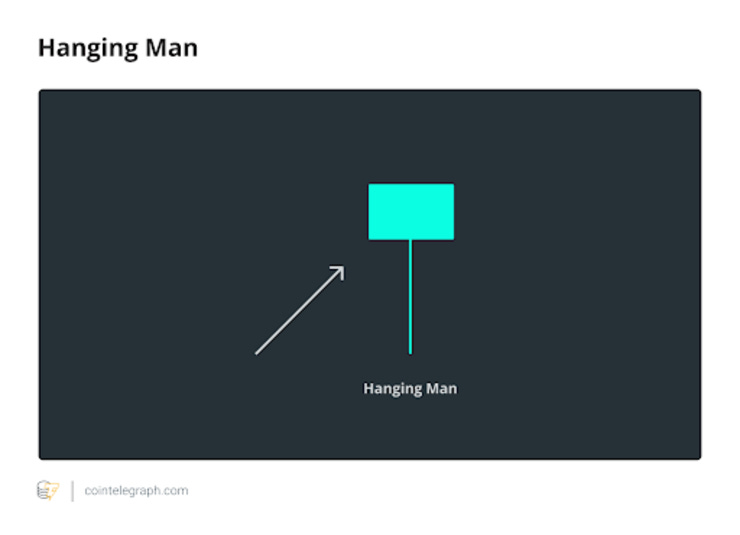
The Hanging Man is a single candle pattern that indicates a likely reversal from bullish price action to bearish price action. This candle has a long lower shadow and a small body and appears at the top of a trend or during an uptrend.
Once again, when this candle is at the bottom of a downtrend, it is called a hammer and signals a bullish reversal — context matters. This candle shows that sellers were able to take control during a portion of the period. It indicates that bears defended the current price and are likely to continue selling through the subsequent candle.
Get to know these candlestick patterns — they are essential to understand as a crypto trader!
Personal Accountability - A Rant
The crypto community (largely represented on Twitter) goes through a few phases a year where a number of members are accused of being scammers, frauds and "larpers." This usually happens when market conditions are uncertain, longs and shorts are both underwater, alt trades look bad and there is potential fear of missing the next big move. The more emotional the market makes traders, the more likely they are to assign blame to others for their own predicament, or to lash out due to jealousy. Most of these influencers are not scammers at all - they are just young people looking to reinvent themselves in a new space or finding their stride in the community.
People often spend more time worrying about the actions of others than they do worrying about themselves. They lose money and are looking for someone to blame - the avatar on Twitter that suggested a trade, the paid group leader that got a call "wrong," or any other obvious target. The truth is, the only person responsible for a monetary loss or bad decision is you. You are accountable for your financial choices - nobody else.
There are REAL scammers everywhere, both in this community and beyond. They prey on people who are looking for easy money or who want to transfer responsibility for hard decisions from themselves to others. DO NOT BE THIS PERSON. The first step to success as a trader (and in life in general) is to take responsibility for yourself and your finances. NEVER send money or crypto to an anonymous person on the internet, period. NEVER send money to someone with an unregulated fund promising huge gains on your money. They WILL steal your money and you will have no way to recover those losses. Learn to trade and invest for yourself!
Trading Tip - Get A Life!
There's no better time than the holidays to highlight one of the most important, yet least discussed aspects of becoming a successful trader - having a life outside of trading.
It is essential to spend time with your family and friends often. Go to the gym regularly. Eat healthy food. Turn off your phone and don’t check your portfolio regularly. Keep specific trading hours and do not trade during your leisure time. Nobody can trade 24/7 — it causes mental fatigue and poor decisions. The more focused you are during the allotted hours that you spend trading, the more profitable and unemotional you will be. The only way to make this happen is to step away from the charts and enjoy the other aspects of your life. It's really as simple as that.
My Preferred Platforms And Tools
This is where I spend my days teaching and learning! Our Discord group is a one stop shop for everything you need to learn to trade and control your emotions. Feel free to DM me on Twitter or respond to this email for questions.
This is where I invest, commission-free. They now let you earn 3% interest on your Bitcoin held in Voyager, so you can compound while trading. Not only that, you’ll get $25 in free BTC when you download & fund.
URL: http://go.onelink.me/4gTR/ba4cd7d3
Rewards Code: WOLF25
I use RoundlyX to buy small amounts of Bitcoin every single day. They automatically round up my credit card purchases (with 10x multiplier) and invest them in crypto. Absolutely brilliant. Passively invest money you don’t need without a thought. Further, they have integrated with Voyager (see above) to offer commission-free purchases.
I use this platform more than any other and have the top tier account (yes, I paid). This is where I do all of my charting and TA and set my alarms to let me know when to check a chart. If you are not using TV, you are not a trader!
https://www.tradingview.com/gopro/?share_your_love=ScottMelker
Uncensorable .crypto domains (like scottmelker.crypto) that cannot be removed by hostile actors.
Gives us the ability to simply send Bitcoin & alts directly to a .crypto extension. Eliminates the confusion of long addresses.
https://unstoppabledomains.com/r/thewolfofallstreets
ESSENTIAL platform for doing taxes. I execute thousands of trades a year and they calculate what I owe accurately within a few minutes. It’s amazing and cheap ($29.95). They were kind enough to offer 10% off to my followers.
BlockFI is where I personally store part of my long holdings. They offer up to 8.6% annually, compounding, depending on the asset (BTC, ETH or GUSD), which is much better than any legacy savings account or investment. You can get $30 in FREE Bitcoin using my code once you deposit $100. Quite literally free money.
Code: melker30
https://app.blockfi.com/signup?ref=melker30
Follow me on Twitter at @scottmelker. This is where I am constantly updating my trades and sharing ideas.
The views and opinions expressed here are solely my own and should in no way be interpreted as financial advice. Every investment and trading move involves risk. You should conduct your own research when making a decision. I am not a financial advisor.