

The Wolf Den #45 - Altcoin Ideas

Trade Ideas And Chart Analysis
AION/BTC
I may have been a bit late to get this one out. I originally wrote this an hour ago when price was still in the blue range. It has taken off since, so I have had to rewrite this. 1066 is the top of the range, so a retest of that as support could be a really nice entry, if it happens. A retest of the descending blue line would be an even better entry. Again, it if happens. Right now, this looks a bit unlikely to jump back in the short term, as it's really pushing up. Keep an eye out for those potential retests.
BAT/BTC
This still looks good. Holding the bottom of the blue range, has broken the descending black support. It retraced the last bullish move up almost 78.6%, which is quite a bit and should indicate that it is ready to reverse. An entry in this area (bounce from range bottom slightly better if it drops) should target the EQ (dashed centerline) of the range at least, if not the top. I am not in this, but if I was I would place my stop comfortable below the recent swing lows - enough to avoid a stop hunt on a wick. But this idea really becomes invalid with another clear breakdown of the range and trading below the previous break. If you take a trade here, size your position to give you enough room for that to happen.
ETC/BTC
I am still in this trade and very slightly underwater - about 2% down from my entry. NOT a 2% loss from a risk management perspective. My position is sized so that a 10% loss on this individual trade would be a 1% portfolio loss. So lots of room here still.
The blue channel break is a very bullish signal, although the follow up has been weak. I also don't love the break down of the black line at 7580. For now, I would consider an entry (if I was not in this) with a move back above that line, and better above the resistance from the local descending channel shown below.
This channel does not quite have the second bottom touch, which is fine for me but may bother someone who is very nit picky. You can draw it as a descending wedge otherwise, which is still bullish. I like this channel, because you can see the clear support and resistance of the EQ (equilibrium, dashed center line). That's a good way to confirm a channel - if the center of it acts as S/R. For now, a move above this dashed line would be a good start. The real trade is above the channel - that offers bullish confirmation. Again, there is NO ENTRY right now, it's just something to watch and trade if it fits your system.
ETH/BTC
This chart continues to look incredible bullish to me. Price has currently broken above a key level of resistance (the blue box) and is ranging. You should know by now that I am very optimistic about Ethereum, both fundamentally and on the chart.
Zooming in a bit, you can see a clear ascending support. Bulls want to see that hold. You can also see the trading range, and that a few candles a go a wick below the range swept the lows before the candle closed back in the range. That's generally considered bullish. At this point, the potential entries, depending on your strategy and risk tolerance would be either a bounce off of ascending support, a break of the small descending resistance in the range, a flip of the EQ (center line of range) to support, or a flip of the top of the range to support. The latter is the "safest" because it offers the most confirmation.
ETH/USD
No trade here specifically - just a follow up to the ETH/BTC analysis. On a wide view, this looks like a massive bullish pennant with a clear bounce from the bottom.
For reference, the two red arrows represents the trades that I have shown on this pair before. The daily clearly broke the longterm down trend and has now tested it twice as support. Bitcoin will have to continue up for this pair to follow.
FTM/BTC
FTM broke descending resistance on April 9th. It never really had the volume I was looking for and has continued trading sideways since that time in a range from 41 sats to 53 sats. Price tested the bottom of the range yesterday at 41 sats and is bouncing on increased volume. In fact, today's daily volume is already more than yesterday's volume with half of the candle left to go. The safest entry was the bounce from the zone bottom. Now, a risk averse trader would look for a break of the range top and retest as support. If you are looking to buy now or in the bottom half of the range, you would set a stop a few sats below the range. 41 sats is the all time low, so there should be a lot of support there for bulls who are trying to avoid price discovery downward.
ICX/BTC
Clear breakout from the blue descending wedge, which should target the top eventually. Then another break from a more local wedge. Since then, price has been trading sideways in a range.
Price is currently at the range top, so no trade here yet. That said, if it can flip that to support (about 3481), this could really start to move again.
LINK/BTC
No trade here, I just have a million people asking about LINK. Right now it is ranging locally. A break above or below that range will determine where it's likely headed. Area of supply and demand are shown, which can act as targets depending on the direction it chooses.
LINK/USD
I shorted this on Phemex at $3.863. I always anticipate LINK making me look like a fool. Price is in yet another ascending wedge and hit the golden pocket retrace (61.8-65%). Everything about this chart screams retrace to me, but LINK has a tendency to do what it wants. My target is around $3, the bottom of that ascending wedge. Rarely reaches the target, so we will see.
MATIC/BTC
I have shared this chart more times than I care to admit. As I have said over and over, price continued to hold the ascending support line that has been there since trading on Binance was introduced. Price dropped into a trading range (blue) with a clear top at 192. There were a number of opportunities for small trade within this range, but as I continually said, real bullishness theoretically starts above 192. Yesterday, MATIC finally broke out above that area.
Here is a zoomed in chart on the 4-Hour. You can see the clear resistance at 192 that was broken. At this point if I was not already in, I would be hoping for a retest of that line as support for an entry. I would personally put an order 1-2 sats above it to avoid being front run if price does drop. I would put my stop loss somewhere below the dashed center line of the channel, called the equilibrium or EQ. Below that would be below the ascending support as well as well back in the channel.
RVN/BTC
I am in this trade from an earlier setup last week and am slightly underwater. No big deal. That said, the chart has developed nicely and looks interesting. Really anything above 232 as support seems reasonable, although the best entry would be a break of the channel.
This is NOT a perfect channel, it's an idea. The top resistance is valid, but the bottom does not have multiple touches. That said, if you trade long enough, you start to see these things, as price tends to travel in channels. To be technical, it would be more of a descending wedge, with the bottom like this. Doesn't change much. Either way, the break of the top is the entry signal that this local downtrend is completed.
WRX/BTC
This one has been tricky. I am showing the old setup, because it DID NOT play out yet, and it's important to review. As I always say, nobody can see the future, all we can do is use charts and the rules for TA to try to figure it out!
Price finally broke above the clear green channel, only to fall back in. Still, price is trading above the centerline (EQ) of the channel. For now, I am looking for another break above, or a drop to the area between the 61.8% fib and 70.5% OTE (optimal trade entry) as a potential area of interest. I have circled that area in red. I am NOT in this trade, but still watching.
XRP/BTC
I posted this trade in a recent newsletter and nothing has changed. It dropped a little bit, but is actually in a potentially better spot here. It's retesting the descending channel and the bottom of the local trading range. This is a very easy trade to take with a relatively tight stop, if you like playing range bottoms and retests. Again, I am NOT saying this will go up - I am saying that the risk reward is very good because it has great potential and only a small loss if you are wrong. That's the idea of trading - taking entries near invalidation to minimize losses, since nobody knows what is going to happen in the future.
XRP/USD
This still looks decent to me - I have posted this chart a few times. The clearest entry was when I posted it, at the bottom of that blue descending broadening wedge. 176 is a nice little resistance to support flip, so I remain short term bullish anywhere above that. Lots of resistance ahead. I would really like to see it above that red line to start feeling bullish from this point on.
Again, bullish and bearish are all about time frame and perspective. This look generally good, but was way more bullish on that bounce off support at the bottom (which I shared at the time) then it does immediately here. Still, a descending broadening wedge should break to the upside eventually and target the top. Macro picture is good here.
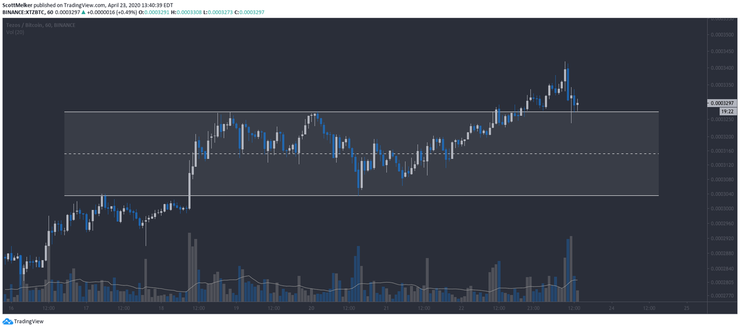
XTZ/BTC
No trade here, just analysis and a review. This chart is really a perfect example of my trading style and also that patience is often required. I waited weeks for an entry and caught it at the first red circle. This represented a retest of the previous all time high - I set my orders there when that swing high was broken, so you can see how long they sat there.
I was slightly underwater and waited weeks again for more action. As you know, it broke up and then consolidated at the range top. The second proposed trade is the other red circle up top, a retest of the range as support. You can see how beautiful the TA has been on this coin.
Unfortunately, this happened after I sent the newsletter yesterday and I did not notice it in time. I shared it on Twitter, so hopefully some of you were able to see it. I added once again to my position there. I have taken quite a bit of profit today on this trade, not for any technical reason but because I am trying to avoid being greedy and it's ALWAYS important to pay yourself.

The views and opinions expressed here are solely my own and should in no way be interpreted as financial advice. Every investment and trading move involves risk. You should conduct your own research when making a decision. I am not a financial advisor.