


The Wolf Den #43 - Bitcoin, Oil, Stocks, Trade Ideas And More

Bitcoin Thoughts And Analysis
Bitcoin looks a bit shaky on lower time frames - I am currently short from $7,000 as a hedge against my longer holdings. My first target is between $6,540 and $6,600 or so. I exited all of my long trading positions this weekend. That said, the big picture has not changed at all and I remain bullish. I see no reason in the chart to start talking about lower lows (below $3,800) and even a drop into the low $5,000s would be a "healthy retrace" of the entire move up.
MONTHLY CHART
Nothing has changed here, but it's always good to zoom out. Bulls want to see the support at $6,540 hold on the monthly close. A close above $7,777 would be even better!
WEEKLY CHART
The levels on the weekly look slightly different. As mentioned last week in the update, you can see that $6,540 is also key on this time frame - last week's candle tested it perfectly as support. The most bearish aspect of this chart is the decreasing volume on the rise, as shown by the red arrow. This is also how the stock market charts look. That said, the sheer velocity and power of the March 12th drop had crazy volume - unlikely to be matched on the way up since it was a few players unloading their massive holdings.
DAILY CHART
We will once again take a look at supply and demand on the daily chart. As I predicted last week ("There is a fresh supply zone (green) that was left behind from the last drop. So that is expected to be resistance, and is a reasonable target if you are bullish for a short term move"), price's rise halted at the green daily supply zone. It has since dropped to local demand, the blue zone. This is bouncing from level to level for now. Supply areas are drawn by extending a zone from the last bullish candle before a sizable drop. Demand is the opposite. The thinking is that there are leftover orders in those zones that were not filled when the large move happened.
A look at the daily Ichimoku cloud offers quite a bit of information. The Kijun (brown line) has been one of the most significant support and resistance lines in the history of Bitcoin. Price is currently sitting directly on top of this line, holding it as support. The breakdown of the Kijun after Bitcoin's all time high was one of the best indicators of the massive drop to come. The Tenkan (blue line) is currently offering resistance... but it did cross the Kijun bullishly, known as a bullish TK Cross just days ago.
Ichi traders would have expected the flat kumo top (cloud top) to hold as support, but that was not to be. That said, the bottom of the cloud is offering support on the past two candles, which leaves a lot of room for optimism. A break below the cloud (especially with it being red) would be bearish, and the cloud and TK would likely become resistance. At present, we would expect the Kijun and cloud bottom to hold as support, even if we see wicks below.
This chart shows the Fibonacci levels of the entire move from $3,800 back up to $7,400. It is normal and healthy to see a retrace of any large move. The 23.6% fib has held as support thus far, around $6,600. That's an area I am watching to potentially flip back long. Each level below that could be a good spot for a trade - in contrast, losing these levels and testing them as resistance could be good shorts.
We have heard a lot of traders expecting a return to the low $5,000s. This chart is the main reason - that would be a "golden pocket" retrace of 61.8%, still considered healthy. So it's worth seeing if this happens, although I am not expecting it at this time at all.
4-HOUR CHART
This chart shows all of the relevant ranges since the bottom in March. The reason I am targeting $6,540 to $6,600 is that this coincides perfectly with the high time frame line at $6,540, as well as the bottom of both the small purple and blue ranges shown. Simple. If price loses that level, I will start looking to the $6,200 area.
Did Oil Really Drop Below $0 On Monday?
Even though I am a professional trader, I have a mentor who has taught me much of what I know. Who better to explain what happened in the West Texas (and US) Oil market yesterday than Christopher Inks of TEXAS WEST CAPITAL. Chris has been trading forex, oil, stocks and later crypto for almost 3 decades. I learn from him every day as a member and admin of his Discord group like many other professional traders - this is the best (and cheapest) group that I have seen, so you should definitely consider joining. I have no idea how he provides as much information as he does, but it's inspiring. He updates countless assets on a daily basis, while providing a college level trading course and answering everyone's questions. Also, you get access to me on a daily basis.
https://www.patreon.com/TXWestCapital
Now onto his article.
Did oil really drop below $0 on Monday?
Yes and no. It was the May WTI (West Texas Intermediate) 2020 futures contracts, which expire today, that closed negative. But that doesn't mean that oil will continue trading at that price. The June 2020 contracts, which expire on May 19, reflect a ~$20 price at close on Monday while the July 2020 contracts closed around $26. Those May contracts detached from the other futures contracts because there was a complete lack of demand for them. Price going negative meant that sellers were willing to pay people to take the oil off their hands. Why would they do this? Because they need it gone since storage is practically filled to the brim as it stands. The problem is that the May contract is at the front of the oil futures curve, which means it is getting hit the hardest because the country is still locked down for the most part. If you're an airline, for instance, then you would usually want to take delivery of the oil but since storage is already full you have nowhere to store it so you can't. Without that demand for delivery of physical oil price continued to fall and for the first time since the NYMEX oil contracts' inception it closed in the negative at -$37.63. So, while the May contracts closed negatively, the future months are still well above $0 and are argued to more accurately reflect the true state of the market. But what if they don't? I will get to that in a minute.
Why did WTI get hit so hard and not Brent? Because the former is transported via pipeline and the Cushing, OK hub's storage is closing in on terminal capacity while the latter is seaborne since it's pulled from North Sea. Being seaborne, Brent isn't normally affected quite as much by storage issues that affect WTI. However, prolonged demand destruction for oil will result in all being significantly affected. This appears to be the most likely result, as global oil storage was already building beyond 70% of capacity earlier this month, according to Steve Puckett, managing chairman of TRI-ZEN International, which is an energy consultancy firm. With oil futures in contango, we can expect to see those future prices converging down toward spot as contract expiry nears. The question is, just how low will spot remain?
I have been vocal about the government's role in the current state of oil prices. By turning on the printing press and manipulating interest rates to artificially low levels, government has encouraged malinvestment. When it comes to oil, this has been seen quite a bit in shale production. Pulling oil out of the ground is much more expensive when extracting it from shale which can cost 50% or more on average and is paid on the front end of production. This is due to the technical nature of shale production which requires horizontal drilling as well as the increased capital costs associated with the transportation of millions of gallons of water to be used in the fracking, and the proppants and chemicals used in the process. Additionally, shale wells tend to have a much shorter lifespan than conventionally-drilled wells since shale oil is trapped in pockets that hold less oil. This means that shale wells decline sharply and simply maintaining production levels requires more significant drilling than conventional wells. However, shale production has risen since 2016 in spite of the associated costs precisely because of the access to cheap capital spurred on by artificially-low interest rates. This allowed companies to burn through cash as they extracted the oil.
All of this excessive shale production, along with increased oil production by the Saudis and Russians, resulted in a supply glut which has been exacerbated by the global productivity slow down in response to the spread of COVID-19. So here we are today with a supply glut, little-to-no storage capacity, and no real demand. In the opening paragraph I proposed the question what if the June and July contract prices don't accurately reflect the true state of the market. What if the market is actually broken and oil prices are lower? Now that we are likely to see the largest glut ever, tanker companies are poised to win big as traders rush to charter tankers for storage so that they can take delivery of oil now and sell it in a few months when the expectation is that prices will be higher. But this only works if demand rises. In the mean time, oilfield service providers will be hit the hardest with companies like Baker Hughes, Schlumberger, and Haliburton already cutting capex, laying off large numbers of employees, and cutting executive salaries and dividends.
Oil demand destruction is very real right now. With projections of April demand dropping by up to 30%, there is reason to be concerned. Such a drop has only been seen once before -- from 1929-1934. At that time, the price of oil dropped from $2/barrel to 0.25/barrel. This is why we saw OPEC+ agree to a production cut of 10 million barrels/day last week, but that won't even go into effect until next month. And, even then, that cut drops off 20% to 8 million/day in July and then down to 6 million/day from January 2021 to April 2022, depending on how the COVID-19 situation continues to evolve. Add to that the likelihood that multiple OPEC+ members will not abide by the agreement (production quotas are often ignored by smaller members) and is there really going to be much of a decrease in supply? If demand sees a drop of 30 million barrels/day, as projected for April, then supply will still continue to grow against demand, even if all members of OPEC+ abide by the agreement. This will necessarily result in lower prices. There isn't any way for demand to increase to the levels needed without countries getting back to production, and that won't be happening in earnest until the fears of COVID-19 are removed and government restrictions are lifted. The longer this takes, the greater the supply glut becomes and the longer it will take for demand to wring the excess supply out of the market. Until it does, oil prices can be expected to remain low.
Investing During A Financial Crisis
CoinTelegraph reached out and asked me to write an article sharing ideas on how to handle investments during a global economic crisis. I put together the linked article with some no nonsense tips on navigating the present situation.
The Wolf Of All Streets Podcast Ft. Ed Felten

The past few episodes of The Wolf Of All Streets have had absolutely incredible guests, including Eric Feigl-Ding, the first American to sound the alarm on COVID-19, Mark Yusko, CEO of Morgan Creek Capital and Michael Corrado, world renowned infectious disease physician who has helped the US Government eradicate smallpox. I aim to provide accurate and factual information from the people who are on the front lines - it has been incredible to speak with such fascinating and brilliant guests.
This coming Thursday's episode features crypto legend Charlie Shrem, so make sure to subscribe!
Today's episodes features Ed Felten, Former Chief Technologist of the FTC and Deputy CTO of the USA (!!!). We discussed contact tracing and its privacy implications, the proper role of government in COVID-19, the post virus "new normal," election hacking and why blockchain is not a voting solution, the best use cases for blockchain, the future of smart contracts, what's up with Libra, why the US no longer has the same lead as a technological hub and how crypto can function as money in the future.
Sponsored By:
RoundlyX allows you to dollar-cost-average into crypto with our spare change "Roundup" investing tool, manage multiple crypto exchange accounts in one dashboard and access curated digital asset content and services. Visit RoundlyX to learn more about accumulating your favorite digital assets when making everyday purchases. Use code 'WOLF" when you sign up for $4 of free Bitcoin.
---
This episode is brought to you by Voyager, your new favorite crypto broker. Trade crypto fast and commission-free the easy way. Earn up to 6% interest on top coins with no lockups and no limits. Download the Voyager app and use code “SCOTT25” to get $25 in free Bitcoin when you create your account
If you enjoyed this conversation, share it with your colleagues & friends, rate, review, and subscribe.
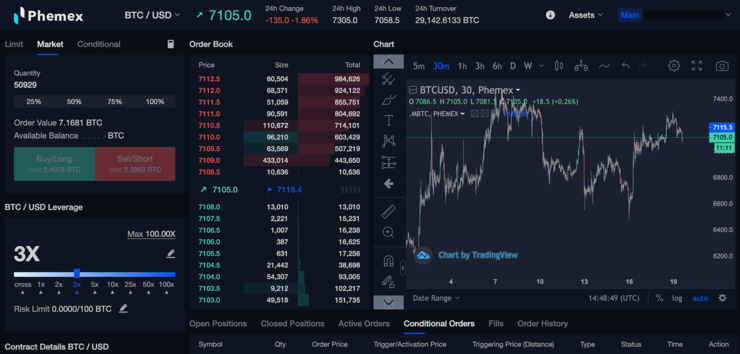
Hedging During Times Of High Volatility On Phemex
As the price of Bitcoin has been subject to significant volatility, many traders have struggled to minimize their risk while trading. Phemex offers several tools and features to help users manage risk and diversify their positions.
One of the most useful features is the ability to hedge by transferring part of the portfolio into the nominal USD trading wallet. This simple action will instantly protect the user’s assets from unwanted BTC price movements, without having to buy and sell stablecoins. Moreover, the nominal USD wallet makes it possible to trade Phemex’s other five pairs without having to worry about the value of the portfolio in Bitcoin.
Phemex is also one of the very few exchanges offering legacy markets assets: the GOLD/USD perp swap allows users to trade an uncorrelated asset and diversify their trading strategy.
These features, tied with a wide offering of order types and the possibility to swing and scalp simultaneously through sub-accounts, make Phemex the ideal instrument for trading whilst managing risk.
Are Bitcoin And Stocks Correlated?
Stocks and Bitcoin have had similar price movement at times over the past few weeks, but they, by definition, are not correlated assets. The idea of ranking correlated assets was developed by Markowitz when he presented Modern Portfolio Theory.
Using a math formula, you can compare any 2 assets on a scale of -1 to 1. 1 means correlated - if one asset moves 5%, so will the other. -1 means inversely correlated. If one asset moves 5%, the other goes -5%. A score of 0 or close means the assets are not correlated. In its 11-year history, Bitcoin has been a .15 - not correlated. This is the closest to 0 of any asset. It recently hit .57, moderately correlated, for a brief time.
It has shown occasional moderate correlation to gold.
The problem with Modern Portfolio Theory is that everything moves nearly to a 1 in a global crisis - including other "safe haven" assets like gold and silver. And Bitcoin STILL only reached a .57 - moderate correlation. This is simple math & defines correlation.
Further, Bitcoin bottomed on March 12th/13th, while SPX bottomed on the 23rd. For that 9 day period, Bitcoin was rising while SPX was falling. Big time. Bitcoin went up 84% in that time. To believe they are correlated directly would mean that Bitcoin was leading the market.
If you believe that Bitcoin leads the stock market, then I have a lovely flying car to sell you. Both have leveled out and have had somewhat similar price movement since. But Bitcoin has still led on low time frames.
What makes an asset correlated?
The tools used to value it.
There are 4 assets in legacy markets - stocks, bonds, commodities and currencies. Everything falls under one of these categories in one way or another. All are correlated to varying degrees. They are all valued based on similar factors, like corporate earnings, GDP and interest rates.
Bitcoin does not find it's valuation in any of these things.
As @MarkYusko pointed out in our podcast conversation (most of what I have said here was shared!), Bitcoin finds value from other factors, like Millennial adoption, government regulation, network value and other completely separate factors. By definition it is uncorrelated.
This is the very reason that all investors should hold some Bitcoin - it offers idiosyncratic risk rather than systematic risk like other assets. Even if it is considered a RISKIER asset, having it in a portfolio reduces overall portfolio risk due to this lack of correlation.
And that is why Bitcoin and stocks are not technically correlated, even if their price movement occasionally converges.
Altcoin Charts
Bitcoin looks shaky. We all know by now that altcoins are only safe to trade during ideal market conditions, which is not the case at present. That said, with proper risk management and depending on your own appetite for risk, there are some potential opportunities to be had. I am still in a number of alt trades, but am tightening up stops in case the market drops. Everything posted below is a riskier than normal trade and the likelihood of the setups failing is higher than usual. Charts quickly become useless if Bitcoin makes a big move. I REALLY HOPE YOU JUST READ THIS PARAGRAPH!
I usually offer more charts and trade ideas, but I DO NOT DO SO, when the market conditions are sub-optimal.
ETH/BTC
I composed a thorough analysis of Ethereum a few issues ago and have shared this trade idea in the past few issues. As you can see, price hit the target - it actually slightly exceeded it before dropping. This was a perfect quick trade for those who caught it. That said, I remain longer term bullish on Ethereum and have been dollar cost averaging into it for weeks, on top of my trades.
Zooming in, we can see that price is now consolidating in a descending broadening wedge (blue lines) above a key support level that was acting as resistance. This is bullish. It has to be said though - if Bitcoin drops, this is unlikely to look great!
MATIC/BTC
MATIC has a single support line that has held since it started trading on Binance - the ascending black line. Price has been trading just above it now for weeks, offering multiple opportunities for profit each time it bounces. It has touched it again today, and I have once again added to my MATIC buys. It works until it doesn't! That said, consolidation above support can lead to an eventual break. I like this trade because it's easy to let go if a candle closes below the line.
Locally, you can see that price is ranging between the pink resistance line and blue support. Lots of confluence in both of those areas. A break above the pink lin at 192 would be the real signal that this is likely to fly again. Below 153 is when it really gets uglier.
XRP/BTC
XRP is in a very interesting spot at present. Price was in a descending channel and has broken to the upside and retested the channel as support. That is definitively bullish movement. The one thing that makes me slightly question this move is the low volume on the breakout and after. We want to see some real volume and buying interest coming in. The blue channel represents the local trading range - a break above would be bullish (at least above the dashed EQ, center line). A break below the range and the black support shown would be bearish, although we have already seen a fakeout below that line. If you like trading breakouts and retests, then the opportunity is presently here.
XTZ/BTC
As you know, I waited months for this trade to develop and fill on those horizontal support lines. This remains the best alt to trade in my opinion, due to the staking structure and general interest. The huge flag that I have been posting forever finally played out. This should eventually target at least the all time high, and then should later make a push beyond based on this bull flag.
Zooming in, we can look for some other trade ideas now that the big breakout has already happened. We can see that price is ranging in the white trading range and is currently just below the EQ (equilibrium, center dashed line). There was a local double top that broke down at the red neckline but seems to have played out now in it's entirety, as price is breaking back above that red neckline. The safest way to play this is a break of the top of the range and retest as support, or buying the bottom of the range if it goes there with a tight stop. A break above the dashed line should at least send price back to the range top.
Legacy Markets
It is no secret that I have remained steadfast in my bearish bias towards the stock market. I have said countless times that the bounce we have seen recently is reactionary - a dead cat that is expected after such an aggressive sell off. This idea is supported by a number of factors, most notably price rising on extremely decreasing volume. I will show you in the charts.
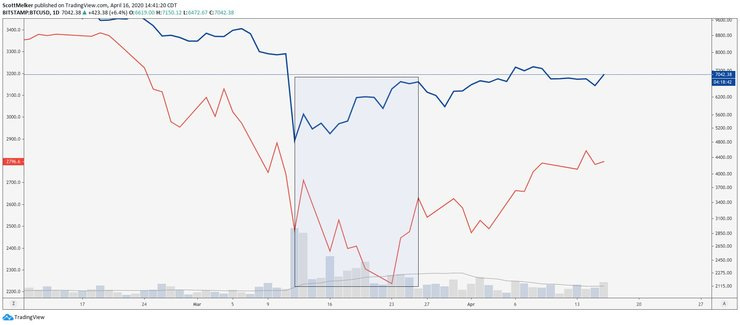
The ONLY argument I can see against further downside is manipulation and infinite QE by the Fed. As you can see in the image below, an increase in the Fed balance sheet after the last "Great Recession" coincided with a rise in the stock market. With the Fed providing a floor, it's harder for assets to drop.
I remain short SPY (I was underwater on my most recent trade until today) and Berkshire Hathaway.

BA (BOEING)
I am looking to short Boeing (for the 3rd time in a few weeks) if it breaks down from this bear pennant (red lines). Very simple.
BRK.B (BERKSHIRE HATHAWAY)
I am proud of this short, because I nailed it almost to the penny (green circle). Further, my Wall Street buddies told me that I was nuts to bet against Buffett. The chart was setup perfectly for a short, so I took it around $197. You can see how long that level remained as support in the past - the first real retest as resistance offered tremendous risk/reward. This was also rising on diminishing volume.
SPY
SPY looks to finally be breaking down from the bearish ascending wedge. As you can see, price managed to retrace just past the 50% level, which is expected after almost any major drop. You can see this on many charts, historically - it is the very reason that Wall Street uses the 50% retracement level, which is NOT technically a Fibonacci number. It's called the "Dow level."
Look at the volume. As you can see, it has decreased steadily since the bottom - price rising on descending volume is a sign of bearish consolidation, not a reversal. I personally think this rise is finished and that we are heading down eventually to test the recent lows, and then further.
The only argument against this, honestly, is the FED printing money to stop it.
Small Business Loans In The USA - A Disaster
I have been writing about the deficient small business loan programs in the United States for the past few weeks, predicting that they would be a mess of epic proportions and that the money would inevitably go to the wrong people.
Yesterday, it was disclosed that Colombia University (Ivy League) received $12,830,199 of CARES funds.
Columbia University President’s salary? $3,900,000. Columbia University's endowment? $10,900,000,000. Columbia University's tuition? $71,460, up 15.6% from 2019-2020.
This private university (I went to one of their rivals) received 12 million dollars in assistance when they have 11 billion dollars in the bank and have increased tuition by 15% in a year.
Ruth's Chris steakhouses got their piece of the pie (or cow) as well. They had $42.2 million in profits last year, spent $5.2 million buying back their stock, and pay their CEO $6.1 million. Ruth's Chris has $86 million in cash reserves. They just received $20 million in taxpayer money from a fund meant to keep "small businesses" afloat.
One day, our tax dollars will pay for all of this.
The SBA allotment of roughly 360B ran out in a matter of days - most small businesses that actually needed the money were unable to even submit an application - or the application they submitted the first day did not make it in time.
Cronyism, not capitalism. Socialism for the rich. Call it what you want, but it's clear the the divide between the haves and have nots in the United States is destined to continue to grow. There are already law suits against the banks for handling of the situation.
Win $1000 On Voyager's Bitcoin Halving Page
The Bitcoin Halving is coming up soon! Voyager put together a landing page which discusses and shares info on the Bitcoin halving, as well as letting people guess the price to win $1k in Bitcoin.
Check out their Bitcoin Halving page here: https://rewards.investvoyager.com/bitcoin-halving/
Voyager is also an ideal place to hold crypto and earn interest. With many banks slashing interest rates to 0.1% to 0.25% interest has evaporated from traditional banking institutions. Voyager is offering 6% on USDC, 4% on Bitcoin and interest on a wide-variety of assets. This is where I invest and hold.
How To Trade the Bitcoin Halving: Whales Vs. Traders
The fine folks at CoinTelegraph invited me to share my thoughts on the market, alongside fellow analyst Michael van de Poppe. We discussed legacy markets and our expectations as well as some tin hat theories on the halving that I aggressively dispelled.
Start Small
Every trader dreams of taking their small stack and turning it into millions. As I have discussed in the past, it takes money to make money - traders who are able to sustain a career are the ones who are well-capitalized. But that does not stop everyone from wanting to turn their 5K portfolio into 50K in months, or their 50K portfolio into 500K.
If you think you have what it takes, then try this - take $50 and mentally pretend that you are trading with $50,000, and that that $50,000 is all of the money you have in the world. Protect that $50 like it's your life savings. If you can turn that into $500 with this mentality, then MAYBE you are ready to step up your game and trade with a larger stack.
The larger your portfolio becomes, the harder it is to protect. Start small, but maintain the same rules, mentality and risk strategy as if you were trading with millions. Scale up when you are ready.
The views and opinions expressed here are solely my own and should in no way be interpreted as financial advice. Every investment and trading move involves risk. You should conduct your own research when making a decision. I am not a financial advisor.