


The Wolf Den #41 - Trades, Markets, OBV, Metals, Stimulus and More

Bitcoin Thoughts And Analysis
Bitcoin is at a unique spot at the moment. From reading Twitter, it seems that retail traders are very eager to short, particularly at the current level of $6,900. They could absolutely be correct - I shorted just above this level successfully a few days ago. That said, when I see multiple people discussing the same idea, it makes me weary. This could be a very "crowded trade" meaning, that a savvy trader could take the other side, assuming a whale will use that liquidity from those obvious shorts to move price up. Not saying that will happen, but that's the mentality you need to take as a Bitcoin trader.
As always, I will present an unbiased analysis of the charts... and at this time I think it's pretty mixed. I can see arguments for both sides.
MONTHLY CHART
Nothing has changed here. The key levels are the same. We want to see this candle close the month above $6,540. Above $7,777 would be even better.
WEEKLY CHART
The weekly chart is mixed. Price has clearly reversed after the March 12th drop. That said, volume has decreased each week as price has risen, which is NOT a sign of a true reversal and COULD be a sign of bearish consolidation for another move down. This gives me pause on the bullish case. Price holding that black bottom line at $5,297 was really nice - this area should be a major support if price dropped down that low again.
We can see just how important $6,540 is on this time frame as well. That's exactly where the current weekly candle bottomed out before the move back up.
DAILY CHART
TD Sequential is vacillating between a red 5 and a green 1. Not surprising, since the large drop was 4 candles ago, so this candle is now comparing to the candles post drop (4 candles before). A daily close above roughly $6,872 would end the bearish count. I recently wrote a full lesson on TD Sequential in Issue 39.
I posted these blue supply and demand zones last week. As you can see, the demand zone was pierced, but has supported candle closes for the past 5 days (pending today's close). Pretty cool. If this area holds, from this perspective, we should see a move up to the higher supply zone. There is a fresh supply zone (green) that was left behind from the last drop. So that is expected to be resistance, and is a reasonable target if you are bullish for a short term move. 2 days ago saw a wick go all of the way up to the bottom of that zone. Also pretty cool.
4-HOUR CHART
Cool chart. This is all of the trading ranges that have formed since the March 12th drop. You can see that price has slowly leveled up from zone to zone. The top of the red zone and the EQ (equilibrium, center dashed line) of the blue zone are in perfect confluence around $7,000. This is a strong case people are offering for shorting this area. That is a lot of resistance.
More confluence for the bear case? Price retraced the last move down (from roughly $7,200 to $6,500) back to the golden pocket, right around the 61.8% fib. That's a classic short for Fibonacci traders.
Everyone was talking about this head and shoulders, which is ugly and arguably not valid. Well, it has been invalidated - really nice fakeout by bulls. Price dropped below for a few candles, appeared to retest it as resistance and then... price went back up and flipped the red neckline to support.
This is why I am long. Clear bullish divergence with RSI on the 4 hour chart. As you can see, there was a hidden bearish divergence at the top of this move, which sent price down. Once you see a bull div, it effectively cancels. the bearishness. So now I will watch for a bear div or hidden bear div. I am cautious here, because this bull div may have already played out at this point.
This bullish divergence is confirmed on OBV. I wrote a quick tutorial on this indicator below! There could be some hidden bearish divergence forming now (not shown), so this bears watching. No pun intended.
The Wolf Of All Streets Podcast Ft. Zac Prince

Zac Prince, CEO of BlockFi and I thoroughly discuss the crypto crash from March 12, 2020, how leverage exchanges, and Bitmex specifically, were responsible for the second leg of the crash, the relationship between global and crypto markets, why it's time for crypto and the dollar to shine, and The Frozen 2 soundtrack's greatest hits.
Be on the lookout for Thursday's episode. I somehow convinced Dr. Eric Feigl-Ding to come on the show. He was the first whistleblower in the US on COVID and has become the voice of reason in the fight. Short of Anthony Fauci, I am not sure we could have a more informed and interesting guest.
Altcoins
There are some promising setups, but be VERY careful. Bitcoin could definitely make a big move which could be bad for any of these. I have not shared ICX, FTM, ETC, MATIC or XTZ again, as I have posted them many times and nothing has changed. As you know, you can make those charts your own and follow along without updates. They are all valid trades and still look decent. You can look back to previous issues if you want to see my thoughts on those trades.
BAT/BTC
BAT appears to be in a decent spot. It broke temporarily below the blue trading range (this is called a deviation) and then flipped the bottom back to support. When that happens, we expect a move to at least the equilibrium of the range, which is the dashed center line I refer often to as the EQ. Also, price has broken the local descending resistance, which should target the top of that descending line at 3185 or so. To add confluence, price retraced the entire local move from bottom to top beyond the 70.5 retracement level, often referred to as the "OTE" or optimal trade entry. Simply, it massively retraced the move down and should head back up.
ETH/BTC
I did a full analysis of this last week, so this is just a quick update. As expected, price has consolidated around that black support line and formed a bull flag. It is currently attempting a break out. If successful, the target is the pink line.
LINK/BTC
I actually shorted LINK yesterday on the USD pair on Phemex. I am rethinking that decision. The BTC pair showed a clear bear div here on the 4 hour in an ascending channel. Since then, price broke down from that channel, which should lead to a retrace down. However, I now see hidden bullish divergence, which cancels the idea of the bear div.
I am bullish on LINK long term - very bullish. But I was looking for a nice swing trade after this massive move up. Still, at this moment it is testing that formed ascending support as resistance so I will hold the trade in small profit.
The weekly chart shows why I am macro bullish! A massive ascending channel, with last week popping right off of the EQ. This looks like a stairway to heaven.
LINK/USD
This is also in an ascending wedge, but has not broken down. Price tapped the golden pocket, hitting the 61.8% fibonacci level of the big drop. I am looking for a retrace back the 2.9 or even 2.6 area before further movement up, but LINK has a way of defying gravity! This could just continue up.
RVN/BTC
I continued to advise caution on this pair for months, seeing that red resistance line come into play over and over again, watching the support area continue to take a beating. On a macro level, this still does not look great. However, zooming in there may be an opportunity for some quick profit.
This pair seems to have bottomed and is breaking resistance on the hourly. I have not taken this trade, I am too busy writing a newsletter! Targets would be the top of that descending line at 254, and the huge blue resistance one above, around 267.
WRX/BTC
I continue to post setups on this pair, because it continues to show some potential opportunities. As you can see, price has formed a large (green) descending channel after a sizable move up. It is debatable whether this can technically be called a bull flag, due to the length of the consolidation and the retrace past 50%. Either way, it is a bullish consolidation pattern - and you can see there is another small descending channel (blue) that price is locally in. If that breaks up, I will be watching for a move to the top of the green channel and then a break above. Target of that move is shown, IF we consider it a bull flag.
The Case For Bitcoin And Gold
I think it is quite clear that I have little love for Bitmex and for it's CEO Arthur Hayes, because I believe that the platform is designed to steal money from traders and pad his pockets.
That said, the guy is clearly extremely smart and this recent blog post is brilliant. This is one of the best things I have read in a while and is a strong and concise case for hard assets in a future of endless money printing and government control - a definite MUST READ.
One Image Captures It All
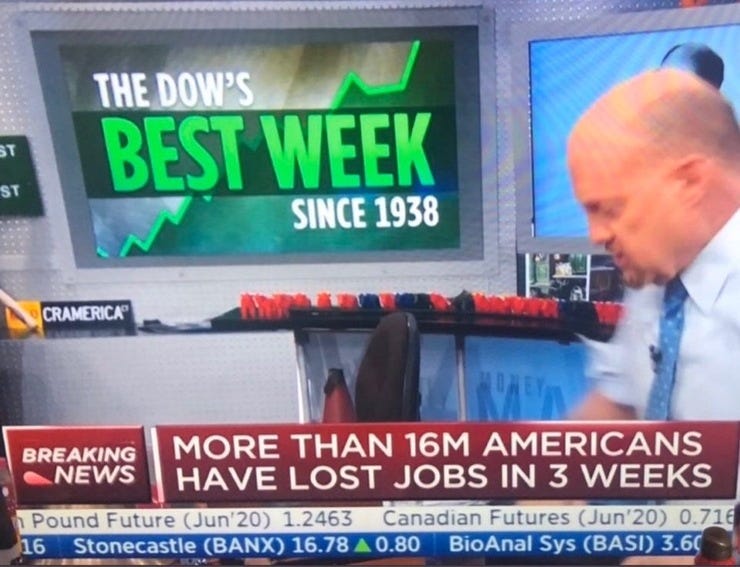
This image was circulating Twitter on Friday and really does capture everything that is wrong with the market in the United States. On the same screen it shows the largest increase in unemployment in history by many multiples, and a graphic showing that the Dow had it's best week since the Great Depression.
The disconnect between these two ideas is astounding. While Main Street suffers, the stock market goes about it's merry way, propped up by Quantitative Easing through printing endless money.
The Fed's balance sheet has increased by nearly 10 trillion dollars - the amount of which is allotted to helping the people is less than 10% of that.
The system is rigged.
On-Balance Volume (OBV) - Follow The "Smart Money"
OBV is a great indicator and one that I used to use quite frequently for finding divergences. I am coming back to it slowly.
It is a cumulative indicator for measuring volume flow. It can help you to understand the level of conviction with which bears are selling and bulls are buying. Simply stated, it’s showing you buying or selling pressure. As you know, volume analysis is essential and this helps to simplify it by showing when price is dropping or rising on low or high volume.
You can measure the volume of any candle with a simple volume indicator on your charts. However, the OBV indicator helps you to see the volume trend better and moreover, to know when “smart money” comes to play - if OBV is rising while price is dropping, then smart money is likely buying retail's panicked sell off.
You can read about my divergence strategy with RSI- it applies to any oscillator. I wrote about it in a recent newsletter and can be used successfully with OBV:
As mentioned, OBV is designed to show what the "smart money" is doing. From Granville, who invented the indicator - "when volume increased or decreased dramatically without any significant change in the issue's price, then at some point the price would "spring" upward or downward. It appears that as institutions (pension funds, investment funds and large trading houses) begin to buy into an issue that retail investors are still selling, volume increases as the price is still slightly falling or leveling out. Over a period of time, volume begins to drive the price upward and the converse then begins to take over as the institutions begin to sell their position and the retail investors begin again to accumulate their positions."
You can read more about it in the following two articles from Investopedia - much easier than me writing a longwinded piece on it when it's already been done!
This momentum indicator was designed to predict when major market moves would occur.
Goldman Sachs Is Bipolar
Goldman Sachs seems to flip flop more than footwear on a California Beach. As I recently wrote, Goldman Sachs went from "only a .5% drop in GDP" to "Great Depression" in 1 week - and now they are back to saying that the bottom is in and everything is fine.
There are some key points in this article that I do agree with. First, as I also said last week, markets often bottom before economies. If you believe that everything is now fine with the virus, then the bottom could be in. They state an important caveat - “If the U.S. does not experience a second surge in infections after the economy reopens, the ‘do whatever it takes’ stance of policy makers means the equity market is unlikely to make new lows,” said Kostin. Do we really believe that the US can reopen en masse and that we will not have a second wave of infections? I don't believe that, so I find their premise for optimism to be shaky.
The single thing that the stock market truly has going for it is infinite Quantitative Easing. It could be enough to keep it from making new lows, but that's a risky proposition to bet on.
How To Use Your Stimulus Check
Regardless of what country you live in, there's a chance that you will be receiving a stimulus check or compensation for lost wages in the coming weeks. Most people will not have a choice on how to spend this check, because they will need it to survive. If you do have the luxury of making a decision, here's how you should consider spending it.
Cover essential expenses - Rent, mortgage, food etc. This is obvious, but I can't leave it off the list. Essential living expenses come first.
Make sure next month's bills are covered - If your basics are covered, experts say you should sit down and prioritize which bills to pay next. While many people won’t receive enough of a stimulus payment to cover all of their monthly bills, especially if they’ve lost their job, you can make a list of which ones are most important.
Put it in your emergency fund. It’s a good idea to save at least some of your stimulus payment. Even if you’re financially secure now, an emergency fund, or rainy day fund, is a financial backstop if you later lose your job or experience other financial hardship as a result of the pandemic. Everyone should have a minimum of 3 months worth of expenses saved and set aside in cash. 6-12 months is even better. This is cash that is separate from all of your other portfolios and is sitting somewhere that it is readily available.
Buy Bitcoin. If you have the rare luxury of not needing your stimulus check and already have an emergency fund, then investing a bit in Bitcoin is a great hedge against global uncertainty and currency inflation. Buy it and forget about it. The same could be said for Gold, but that's not why we are here!
Donate it to someone in need. Most people are struggling at the moment. If you truly do not need the stimulus and it happens to come your way, consider giving it to a friend or family member in need, or donating it to an organization that will distribute it wisely.
I can only speak as an American, but my position has been loud and clear in these newsletters. This stimulus package is not a gift to the people - it's a low cost bribe to keep everyone in check... and one that our children will pay for ten fold in inflation.
Precious Metals
It is worth taking a look at Gold and Silver, as both have performed well in the past few weeks. I own a bit of both as investments and hedges, not as a trader. A small position in metals is a nice way to diversify your portfolio.
XAG (SILVER)
Silver took a major hit when the economic crisis began, not living up to it's reputation as a safe haven asset in the short term. That said, it bounced beautifully from the descending former resistance and closed the monty back in the trading range that has been the story since 2016. I view this as very bullish movement, and am long silver with a target of the EQ of the range (dashed center line) or even 18.19 (the black line above). My stop is just below 14, because that would retrace this entire bullish monthly candle and to me would invalidate my idea that silver is bullish here.
XAU (GOLD)
Gold is going insane. The monthly chart shows a multiple year uptrend (ascending channel) that has finally broken up. This is a monthly chart, so we still need to see a candle close above the channel as confirmation. You can see that the past 2 monthly candles broke above before dropping and closing at resistance.
The horizontal channel at the top is a classic supply zone, drawn off of the last bullish candle before a sizable move down. I have described this a number of times. The theory is that many sell orders were left here when price quickly exited, leaving leftover supply. As mentioned above, the previous 2 monthly candles were strongly rejected from this area. Each time the zone is tapped, the standing orders and supply decrease, leaving a clearer path for movement up down the road. That is what we are seeing now.
It's hard to trade this here, but flipping that supply zone to support would be very bullish.
Voyager
Voyager is my favorite crypto broker. You can trade crypto fast and commission-free. Earn up to 6% interest on top coins with no lockups and no limits. You literally earn interest on your holdings while you trade at a rate higher than you can get in any legacy bank account or fund.
This is where I personally invest in Bitcoin on a daily basis. They are a publicly traded company on the Canadian Stock exchange - I trust them implicitly to protect my funds.
Download the Voyager app and use code “SCOTT25” to get $25 in free Bitcoin when you create your account.
https://www.investvoyager.com/
Phemex
This newsletter is sponsored by Phemex, the only leverage exchange where I now trade.
Here are a few important points:
Institutional Background of the team - led by over 8 former Morgan Stanley Executives
6 Crypto trading pair + GOLD/USD
Phemex’s design criteria (<1ms latency speed, >300k tps, >99.9999% availability)
Sub-Accounts (Different from BitMEX and Bybit, allow to hold long and short positions at the same time, or lend accounts to fund managers)
USD settled contracts, less risky and simple PnL (Different from BitMEX and Bybit)
Proprietary Cold Wallet System
3 Withdrawals per day (Different from BitMEX)
Traditional financial products soon, after licensing from MAS
Chainlink, Tezos and Litecoin trading now live. New pairs coming soon
Fund managing options (Up to 200 Sub-accounts, simplified withdrawals, full API integration)
SIGN UP HERE AND GET FREE BTC!
Music Corner
Bill Withers passed away recently - he was one of my favorite artists of all time, so I have been listening to his music again of late. This morning I was listening to "Lovely Day," and remembered that I used to play it live all of the time. That sent me searching into my mixtape archives until I found it here.
This mix series features live recordings from a party that I used to play every Thursday in Miami. While I was best known for my mashups and for playing stadiums and clubs, my real passion was always smaller venues and the music that I loved - soul, R&B, hip hop. The mix above is a good representation of the music I truly loved to play and that I still listen to most of the time.
Also, it's a decent example of my former DJ skills!
The views and opinions expressed here are solely my own and should in no way be interpreted as financial advice. Every investment and trading move involves risk. You should conduct your own research when making a decision. I am not a financial advisor.