


The Wolf Den #4 - on vacation, but the crypto market never sleeps.

BTC Analysis And Thoughts
Bitcoin market structure is technically bearish after making a lower high, followed by a lower low with a break of high time frame support. That said, price is trading in an interesting area, which I will discuss below. I would be very careful trading Bitcoin in this zone. I am personally on the sidelines with little interest in trading at the current price. My last trade was a small loss, after going long at $7,100. I moved my stop up after price went my way, to $7,080. Insignificant. I once again managed to keep my loss very small, the key to sustaining your career as a trader.
MONTHLY CHART
As discussed over the past few weeks, Bitcoin lost the key support at $7,777, retested it as resistance and has continued to drop. No surprises here.
Interesting to note - the $6,100 - $7,777 range (give or take) has been the most consistent area for Bitcoin trading in 2018 and 2019. Price effectively spent 9 months trading in this area in 2018, with deviation above and below. In April of 2019, price blasted through this area on the move to $14,000 - but it was a common and correct idea that it would be revisited. Here we are, once again in the middle of that zone. A break below would effectively invalidate longs, while a move back above would invalidate shorts.
WEEKLY CHART
The weekly XBT chart shows massive potential bullish divergence in oversold territory on Stochastic RSI. It is also there on standard Stochastic (not pictured). It technically confirmed last week, but the oscillator is currently pointing back down (the week just started, so it could easily move back up), so I do not fully trust it yet.
This is the fourth time that this has happened since the Bitcoin top (pictured above). The first moved price from $6,400 to $9,900, the second preceded the pump from $3,200 to $14,000 (!!!) and the third predicted the move from $7,400 to $10,400 just weeks ago. What will the fourth one in the sequence do if it confirms?
I love looking at larger time frames with Bitcoin, it really gives you a complete understanding of what is happening. Zoomed in from the monthly to the weekly, we see slightly different areas of support and resistance (if you zoom in further, they will continue to change). As with the monthly, price broke down a key level ($7,634 in this case) and has tested it as resistance. Once again, shorts become dangerous above this area, while longs become questionable below $6,100 or so.
DAILY CHART
The daily line chart showed a hidden bearish divergence 11 days ago with RSI, which I completely missed. This was a clear sign that price was likely to continue down. That said, price now is showing potential bullish divergence on the line chart (RSI would have to have a definitive elbow up today), which would be a likely signal of the bottom. Combined with the support area shown on the weekly chart, this could end up being a great long entry if this divergence confirms.
Side note: I like to look for divergences on the line chart, because it eliminates a lot of the "noise." The line chart only accounts for candle closes, not the action in between. That said, if you use wicks on the candle chart to find divs, you will not see this divergence on the daily chart.
4 HOUR CHART
Do you remember the blue lines of support that I shared last week? I was long at $7,330 and exited IMMEDIATELY (shared in last newsletter) when both of those lines of support were broken and my idea was invalidated. It is a good thing I did not hold on to that position and a great illustration of why traders exit losers quickly when their ideas are proven wrong.
At present, price is holding a local line of support at $6,850, but broke down a key level at $7,099 - the area of my last trade and stop loss. Locally, price has formed a descending wedge (red line), which statistically should break up.
Altcoin Trades
The crypto market looks exceptionally shaky at the moment - when BTC looks weak, altcoins tend to suffer. At the moment, there are coins that I am watching, but I am only willing to take small trades. I exited almost every alt coin trade that I was in, either by tight stop loss or taking profit. It's been an uneventful trading week - choppy results at best.
KNC/BTC - 12/17 ENTRY (TODAY)
I happened to check into Twitter this morning and saw a few people I respect looking at this coin. I caught an entry at the blue line at 3513. As I said, the market looks very shaky, so my stop loss here is tighter than 80s basketball shorts - just below 3500. Simple and easy to release.
FUN/BTC - 12/10 ENTRY & CLOSED
Fun offered a very clear trading opportunity this week. I pulled up the chart after not looking at it for almost two months and found that price had continued traveling in a channel that I drew in October near the local highs. The ideal entry would have been a bounce off of the channel bottom, between 33 sats and 38 sats. However, a clear resistance formed at 44 sats, which flipped to support and was my entry, as shown above. I took profit at 56 sats, for a gain of 27%.
FUN/BTC - POTENTIAL NEW TRADE (12/16/19)
I am considering another entry at 44 sats on FUN - a repeat of the previous trade. This would be a clear retest of support and is also near the bottom of the ascending channel. Invalidation would be a clear break of the blue channel with a candle close. As I often mention, I like setups like this because the invalidation level justifies a tight stop loss. Further, I can raise my stop if the trade goes my way.
Defining A Good Trade And Random Reinforcement
The goal of a successful trader is to make the best trades. Money is secondary. - Alexander Elder
The idea raised in this quote is essential and often misunderstood. If not by how much money is made or lost, what defines a good trade and a bad trade?
A good trade should be defined as one where a trader planned their trade, traded their plan and managed their risk — those are all elements they can control. It is NOT defined by the outcome.
A bad trade, on the other hand, is where a trader fails to follow their rules and executes trades against their better judgment. This is always going to be a bad trade even if it happens to be profitable.
This leads to the idea of Random Reinforcement, which is a rarely discussed reason that many traders fail.
As defined by Investopedia, “Random Reinforcement” is:
Using arbitrary events to qualify (or disqualify) a hypothesis or idea; attributing skill or lack of skill to an outcome that is unsystematic in nature; finding support for positive or negative behaviors from outcomes that are inconsistent in nature—like the financial markets.
The market has a tendency to reward bad habits, while concurrently punishing positive behaviors, especially with a small sample set. Let’s take a theoretical example to display this principal.
Bob wants to leave his job and become a crypto trader. He sets aside some starting capital, follows the markets and the “big names” on twitter. He sees them talking about an altcoin, opens the chart and sees that price is rising fast. He buys, goes to take a shower, returns and sells for a quick profit. He does this again before lunch and strings together a few successful trades. Bob starts to feel confident that he is a talented trader.
So what is the problem? Bob is trading without a system or a plan and is being fooled into believing that a successful outcome on a few random trades is indicative of likely success moving forward. The market has rewarded his bad behavior. We know how this story ends — Bob continues to make impulsive trades and eventually loses his capital.
There is a flip side to this coin. Let’s say that Bob learns his lesson and spends months developing a trading plan, complete with risk management, proper portfolio allocations and trading rules.
He identifies a trading opportunity that fits, takes the perfect entry and… stops out of his trade. He tries again. And again. He loses 7 times in a row. The market is punishing Bob for his good behavior. Bob starts to doubt his system and takes a high-risk trade that violates his system — and is successful. To his surprise, he tries this a second time and also makes money. Bob is now back to square one, trading without a system because the market has rewarded his bad behavior.
Through random reinforcement, the market has re-conditioned the way Bob approaches trading by distracting him away from his trading plan. He has allowed himself to be manipulated into an impulsive, high risk, revenge based trading approach.
Even if Bob makes money in the latter scenario, he has taken a BAD TRADE.
The bottom line? Judge yourself by your process, not the results - you cannot control what price does after you take a trade.
Unstoppable Domains Co-Founder Brad Kam
Tell me about Unstoppable Domains and what issues your company is aiming to solve.
We are a San Francisco-based company building domains on blockchains. Unstoppable Domains is backed by Draper Associates and Boost VC and has received grants from the Ethereum Foundation and the Zilliqa Foundation.
Blockchain domains solve 2 major problems:
Payments - with blockchain domains you can send and receive cryptocurrency. We simplify crypto payments by replacing long addresses with a single human readable name.
Websites - use the domains to build censorship resistant websites.
Through blockchain domains we hope to rebuild the internet in a decentralized way that gives individuals the power to pay each other, launch websites and develop content freely.
How are blockchain domains different from traditional domain names?
Within traditional domains:
Payments are not native.
There is no censorship-resistance.
Centralized entities such as ICANN control the internet.
Blockchain domains:
Offer a major UX improvement for payments by replacing cryptocurrency addresses with human-readable names.
Are controlled by their owners. Your keys, your domain. This is a self-custody solution.
Allow users to use their domain for payments and as a website, at the same time.
How does a blockchain domain replace a cryptocurrency address with a human-readable name?
You control the domain so you are the only person able to associate cryptocurrency addresses with it. The user inputs their cryptocurrency addresses on the blockchain choosing from the 50+ cryptocurrencies we support such as BTC, ETH, and LTC. Then when someone types theirname.zil or theirname.crypto into an integrated wallet, the wallet looks up that domain on the blockchain, finds the appropriate address, and sends. It’s that simple.
Integrated wallets include Trust Wallet, Coinomi, Atomic Wallet, and more.
Speaking of .crypto, this extension is new right?
Yes! We just launched it today on the Ethereum blockchain. We are excited because this is a domain extension that the entire cryptocurrency community can unite behind. It is cryptocurrency agnostic and you can attach over 50 different cryptocurrency addresses to your domains.
Thanks for sharing! How can members of my community get their own domain name?
First create an account on our website using this link. Then search to find the blockchain domain name you want, scottmelker.crypto for example, and purchase the blockchain domain using cryptocurrency or a credit card!
Create an account now!
https://unstoppabledomains.com/r/thewolfofallstreets
Lesson: 5 Bullish Candlestick Patterns
Candlestick charts are favored by crypto traders due to their visual appeal and simple to understand nature. Their history lies in the Japanese rice trading and the system has been updated and utilized throughout the years, becoming the most popular method of charting assets.
They are called candlesticks because of their rectangular shape and long lines (wicks) formed by price action during a certain time period. Candlesticks can also give clues to price action and the mood of the market towards an asset. Over time, multiple candlesticks form patterns that give traders signals that help bulls and bears make trading decisions.
Here are 5 simple candlestick patterns that indicate a bullish price movement that every crypto trader should know.

The bullish engulfing candle appears at the bottom of a downtrend and indicates an increase in buying pressure.
This pattern often triggers a reversal in trend and it indicates that buyers have entered the market and are likely to drive prices up further. The pattern involves two candles, with the second candle completely engulfing the body of the previous red candle.
This happens when price opens lower on the second day than the first day’s close, but price increases throughout the candle, closing higher than the opening of the first candle. The ideal way to trade this pattern (and any pattern) is to wait for confirmation on the following candle that price is continuing up. Conservative traders do not enter until the next candle closes higher than the price where the second candle of the pattern closed.
Gaps are rarely seen in crypto markets, or candles opening significantly higher or lower than the previous one because there are no breaks in a 24/7 market. Therefore, an equal bottom (shown above) qualifies as a bullish engulfing.
It is important to note that context and placement matter with every pattern. This is NOT valid in an uptrend, and is, in fact, a bearish pattern in that context — it is only tradable when it appears at the bottom of a move.
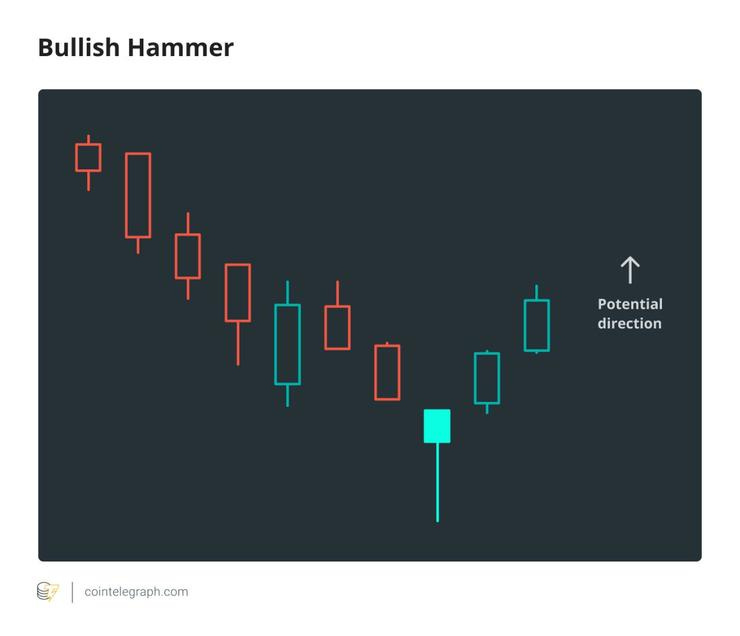
The bullish hammer is also a candle that indicates the likely bottom of a trend. It is characterized by a long wick at the bottom with a short body on top. That shows that bears pushed the price down during the time frame, only to see significant buying pressure step in to close higher than the candle open.
Many traders consider a candle a bullish hammer even if the close is slightly below the open as long as there is a long tail and small candle body on top. This is a single candle pattern, but smart traders wait for a confirmation in the change of direction, characterized by subsequent bullish candles and increased buying volume.
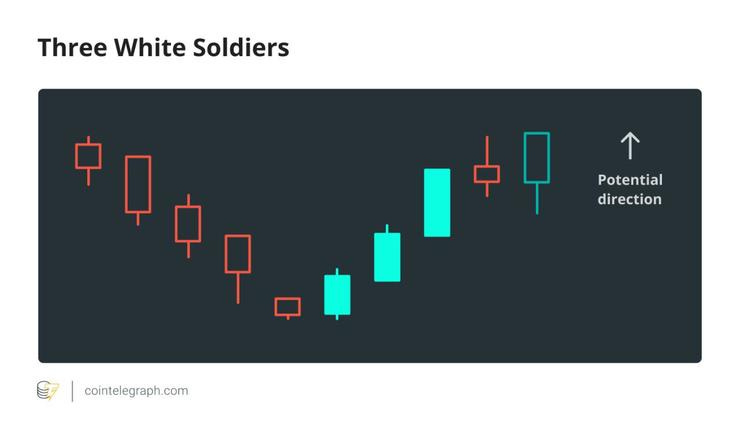
The three white soldiers pattern occurs over three candles. It consists of consecutive long green candles with small wicks, which open and close progressively higher than the previous day.
It is a very strong bullish signal that occurs after a downtrend and shows a steady advance of buying pressure.
In general, when a candle is closing with small or no shadows, it suggests that the bulls have managed to keep the price at the top of the range for the session. The three white soldiers appear when buyers take over the rally all session and close near the high of the day for three consecutive candles.
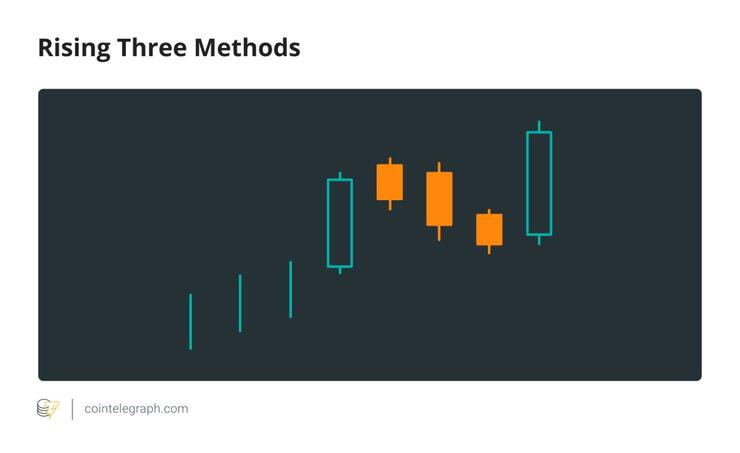
The “rising three methods” is a bullish candlestick pattern that is comprised of three short bearish candles contained within the range of two larger bullish ones.
The pattern shows traders that — despite some selling pressure — buyers are retaining control of the market. For classical pattern traders, the rising three methods pattern often forms as a bull flag or descending wedge — a form of bullish consolidation after a clear move up. This is a continuation pattern of a bullish trend, not the sign of a bottom or reversal.
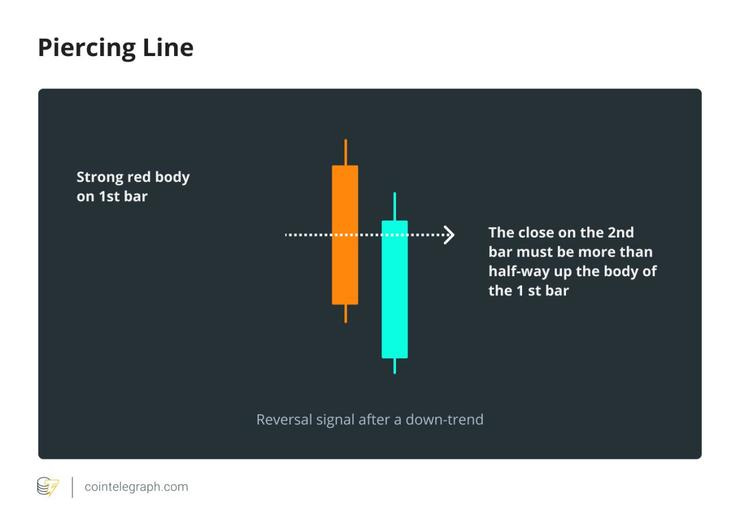
The piercing line is a two-stick pattern made up of a long bearish candle followed by a long green candle.
A key signifier of this pattern is a significant gap down between the first candlestick’s closing price and the green candlestick’s opening. At the beginning of the trading session, it often appears bearish because of the significant drop during off-hours.
However, buying pressure increases throughout the candle, with a close more than halfway up the body of the first, bearish candle, indicating that bulls have taken control and are interested in buying at the present price.
There are hundreds of patterns that a trader can learn when mastering Japanese candlesticks but these are just a few simple ones that can help any trader in any market.
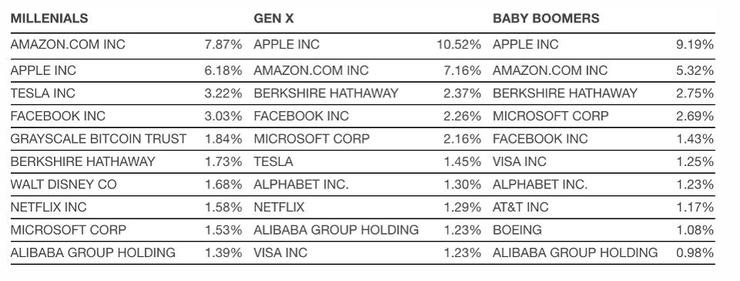
Bitcoin Beats Netflix And Microsoft Among Millennials
There is a clear generational shift in how people approach their investments. Not surprisingly, younger generations are more interested in Bitcoin and cryptocurrencies and have less trust in the traditional financial services sector. According to a recent report by Charles Schwab, 1.84% of Millennials are invested in Grayscale Investments Bitcoin Trust (GBTC), which is 5th on the overall list of investments for this generation. GBTC is a publicly tradable bitcoin and cryptocurrency investment vehicle, allowing for people to trade it just like they do traditional equities and to purchase it within their retirement funds. If younger generations are this interested in GBTC, imagine how much actual Bitcoin they must be buying!
Below is a chart of the top investments held by Millennials, Gen X and Baby Boomers.
Interview On The Crypto Entrepreneurs Podcast
I had the pleasure of speaking with @CryptoCharles on the Crypto Entrepreneurs podcast. We had a great chat about how to approach markets as both an investor and trader. Follow him and check out future episodes.
My Preferred Platforms And Tools
This is where I spend my days teaching and learning! Our Discord group is a one stop shop for everything you need to learn to trade and control your emotions. Feel free to DM me on Twitter or respond to this email for questions.
This is where I invest, commission-free. They now let you earn 3% interest on your Bitcoin held in Voyager, so you can compound while trading. Not only that, you’ll get $25 in free BTC when you download & fund.
URL: http://go.onelink.me/4gTR/ba4cd7d3
Rewards Code: WOLF25
I use RoundlyX to buy small amounts of Bitcoin every single day. They automatically round up my credit card purchases (with 10x multiplier) and invest them in crypto. Absolutely brilliant. Passively invest money you don’t need without a thought. Further, they have integrated with Voyager (see above) to offer commission-free purchases.
I use this platform more than any other and have the top tier account (yes, I paid). This is where I do all of my charting and TA and set my alarms to let me know when to check a chart. If you are not using TV, you are not a trader!
https://www.tradingview.com/gopro/?share_your_love=ScottMelker
Uncensorable .crypto domains (like scottmelker.crypto) that cannot be removed by hostile actors.
Gives us the ability to simply send Bitcoin & alts directly to a .crypto extension. Eliminates the confusion of long addresses.
https://unstoppabledomains.com/r/thewolfofallstreets
ESSENTIAL platform for doing taxes. I execute thousands of trades a year and they calculate what I owe accurately within a few minutes. It’s amazing and cheap ($29.95). They were kind enough to offer 10% off to my followers.
BlockFI is where I personally store part of my long holdings. They offer up to 8.6% annually, compounding, depending on the asset (BTC, ETH or GUSD), which is much better than any legacy savings account or investment. You can get $30 in FREE Bitcoin using my code once you deposit $100. Quite literally free money.
Code: melker30
https://app.blockfi.com/signup?ref=melker30
Follow me on Twitter at @scottmelker. This is where I am constantly updating my trades and sharing ideas.
The views and opinions expressed here are solely my own and should in no way be interpreted as financial advice. Every investment and trading move involves risk. You should conduct your own research when making a decision. I am not a financial advisor.