


The Wolf Den #3. Bitcoin, Altcoins, Mining, DCA, Risk Management

Bitcoin Analysis And Thoughts
MONTHLY CHART
I honestly did not expect to be updating the monthly chart in this edition. As discussed last week, price broke below the key $7,777 level on the last monthly candle. In the past week, price actually tested this line perfectly as resistance, which is bearish on a macro level. I decided to share this even though the candle has weeks left before closing. Why? Because, at the very least, it's an opportunity to show a perfect (for now) S/R (Support / Resistance) flip on a Bitcoin chart. For those who have heard about these, you now have a great theoretical example. Price closed below support on the previous candle and has touched it as the exact top of the present candle. The chart above was posted yesterday.
WEEKLY CHART
The weekly chart still shows a descending channel, which some would argue is a bull flag. I also did not intend to share this today, but it's interesting, as price has been rejected for the moment at the EQ of the channel. The EQ is the "equilibrium," which is the dashed center line. You will hear traders referring to this area, so it's a good opportunity to show you what it is. Price remains more bearish below that line, and a break above would signal a likely move to the top of the channel and then out.
DAILY CHART
This is an idea that I shared on Twitter recently. Any future prediction is highly unlikely to come true, so take this with a grain of sale (or an entire salt shaker full). The reason that I think something like this COULD happen is because it would inflict the most possible pain on retail traders, which is what we expect whales to ultimately attempt to do. In this case, people would likely turn very bullish around $8,200, in time for price to reverse back down and liquidate their positions. On the other side, price reaching $6,500 would turn most people bearish, and would be the ideal price to reverse and sky rocket back up. Fun to watch, not actionable for trading at all. Remember, the point of staring at charts is to attempt to figure out what the bigger players are likely to do and join them. Think like a whale, not like a fish.
4 HOUR CHART
The 4 hour chart offers a very straightforward look at local price action. I was long Bitcoin from $7,330 and added more to the position at $7,375 when price bounced off of the ascending support. I like trades like this, because a tight stop loss is justified if price breaks supports. As you can see, price broke both the ascending and horizontal support lines, so I exited my positions even at $7,355. Bitcoin could still easily go up, but I let these trades go because my particular idea was invalidated. That's the core of risk management and should be your approach to any trade. Regardless of what comes next, you should always trade your plan. My plan said to exit on a support break.
FEAR AND GREED INDEX
The crypto “Fear & Greed” index is presently at 26, "Fear." It was at 32 yesterday. When I shared it two weeks ago it was 17, “Extreme Fear.” Not surprisingly, price has risen a few hundred dollars as fear has slowly subsided. Investors still experiencing "fear" can generally be considered a sign to buy Bitcoin for sentiment countertraders and "greed" is still a distant thought using this indicator.
TA Is Little More Than A Risk Management Tool

Far too many traders view technical analysis as a predictor of future events. They believe that they can see what is going to happen based on a few lines and candles on a chart. If this was the case, all technical analysts would agree on every chart pattern and all traders would be extremely wealthy with a strike rate of 100%. The reality is, you can show a chart to 100 traders and get 100 different interpretations of where price is headed. In that regard, it is a pseudo science at best and you should be wary of any trader who speaks in absolutes about what is going to happen. They're trying to sell you something or are emotionally attached to their idea.
As stated in the tweet above, a chart is merely an illustration of the emotions of the markets participants. Are they fearful? Are they greedy? At what point is the pendulum likely to swing between these two poles? That's what we are looking to identify.
So what is the purpose of looking at a chart at all? For me, a chart is a risk management tool and a way to approach a trade with a definitive plan. This includes where to enter a trade, where to exit in profit and where to set a stop loss at the invalidation point of my idea. Without a chart, managing risk becomes far more difficult, even if all of the lines, patterns and indicators are completely meaningless. At least the chart gives us actionable information. This is why I always say that your method of identifying trades is unimportant - it's the way you use that method to manage your risk that matters, which is where the chart comes into play.
CHARTS CANNOT TELL YOU WHAT IS GOING TO HAPPEN IN THE FUTURE!
Altcoin Trades
It has been a crazy week for alt coin traders, highlighted largely by bullish movement which culminated in the market shakeup caused by the epic MATIC drop yesterday. I have taken a number of trades in the past week - my Trading journal on CoinTelegraph highlights some of these. That said, THANK GOODNESS FOR STOP LOSSES AND RISK MANAGEMENT!
On December 5th, I was already feeling a bit skittish about alt coin movement, so I exited most of the trades that were posted.
I ended up stopping out of WPR for a small loss and FTM for a small gain after moving my stop loss into profit. I remain in ERD, ZIL and XVG, all of which are described below. I just entered IOST and FUEL with small positions and relatively tight stop losses. To be crystal clear - trading alts is VERY RISKY at the moment. Bitcoin could become volatile and I am not sure that the market has settled yet from the MATIC debacle. Be VERY CAREFUL if you choose to trade alt coins right now.
MATIC/BTC - CASE STUDY
MATIC has been the ultimate trading rollercoaster and offers a perfect teaching moment for new traders in the altcoin market. As we all know by now, MATIC went absolutely parabolic, fueled largely by FOMO (fear of missing out) among retail traders. Price offered some traders who caught the bottom potential 6X+ gains. As you know from my last issue, I entered "late" and caught the tail end of the move, exiting much of my position for a 30% gain. Yesterday morning, I wrote the following update, timestamped on the chart that I published on TradingView.
Here we are. After an entry last week at 348, price has nearly reached the all time high of 573. Even entering "late" this allowed for a potential profit of 65%. I exited most of my position on the way up, but closed the rest at 550 (I tend to place my orders slightly below and above key levels). One of my better trades of late. This has major potential for a serious drop.
This is what happened 11 hours after I posted that on TradingView.
This represented one of the largest, fastest drops that we have ever seen on an altcoin. In a matter of minutes, the coin lost nearly 80% of it's value. There's a lesson here, right?
RISK MANAGEMENT IS THE KEY TO TRADING SUCCESS. There were numerous signs that a huge correction was coming, all of which were sell signals for an experienced trader. There was only one reason to continue holding - GREED. Continuing to hold this coin after a parabolic move was the equivalent of trying to squeeze the last bit of liquid out of an already juiced orange. The potential remaining reward was not worth the effort and risk.
Compounding the issue was the fact that a few exchange now offer LEVERAGE trading on altcoins like MATIC, which I think is irresponsible and dangerous, especially for inexperienced traders.
Here is an incredible video which simply explains the cascading effect that often comes with stop losses and liquidations on an asset (Bitcoin, in the case of this video).
On-chain metrics, provided by Glassnode (I am on their advisory board), showed massive movement of MATIC from private wallets to exchanges in the past few days. I tweeted about this 5 DAYS AGO. Yesterday showed a climax in MATIC being sent to exchanges, a clear sign without any technical analysis that large holders were preparing to unload their coins.

In this market, in these conditions, it is essential that you learn to TAKE PROFIT and PAY YOURSELF when you have the opportunity. It is also important that you utilize solid risk management and make sure that you have a stop loss in place to protect you from disaster. There are plenty of people who bought the top of this coin with dreams of making easy money who didn't use stop losses and are now 50% underwater. Don't let that be you.
LINK/USD - 12/5/19 ENTRY
I discussed LINK at length in my previous newsletter and have been talking about it for weeks. Price on the USD pair finally arrived at the support area that I have been watching, so I stuck to my plan and bought LINK at $1.97. There was significant bullish divergence with RSI, shown above on the 6 hour chart. When RSI is coming out of oversold, this is my favorite buy signal. You can hit the "play" button on the link above to see how price has advanced. This setup has quite a bit of potential upside if Bitcoin behaves. In fact, LINK has been one of the few altcoins that often moves against Bitcoin, so if Bitcoin drops this could be a nice hedge.
The LINK/BTC pair was also at an interesting spot, testing the purple support line that would represent the neckline of a head and shoulders and the bottom of the trading range that has existed since October. If this level holds, we can expect price to target the top of the range once again. If it breaks down, it's an easy to trade to cut and wait for a lower entry
LINK UPDATE - 12/10/19
The USD pair bounced perfectly from the demand zone, as I hoped. This look like it will be another successful trade.
The LINK/BTC pair has also bounced right off of the purple support line. As predicted, this has moved against Bitcoin, which has dropped since the initial setup was posted.
ZIL/BTC - 12/3/19 ENTRY
I have been watching ZIL for months, since I drew that descending line in APRIL. Again, patience is key in trading. I was pleasantly surprised when my alarm went off, indicating that ZIL was testing this key area. I entered at 73 sats. Unfortunately, this happened within hours of me releasing the last "The Wolf Den," so I was not able to include it in the previous edition.
Update - price rose to 94 sats and then dropped back to my entry on the MATIC move. I failed to take profit at the first target, as the coin still looked strong - not great trading. I may exit this soon if the alt market does not show signs of life.
XVG/BTC - 12/4/19 ENTRY
In the "most 2017 thing I have written so far in this newsletter," I bought XVG on December 4th on the breakout of a large descending channel. I should note, this channel was not perfect or confirmed, but it was clearly bullish consolidation. Price had bounced just above the 61.8% Fibonacci level, and held a major support at 49 sats. That would have been a far better entry, but I like the confirmation of the bullish movement and my entry at 55 sats - much safer. The tweet from the 4th is below, since I did not publish the chart until days later.
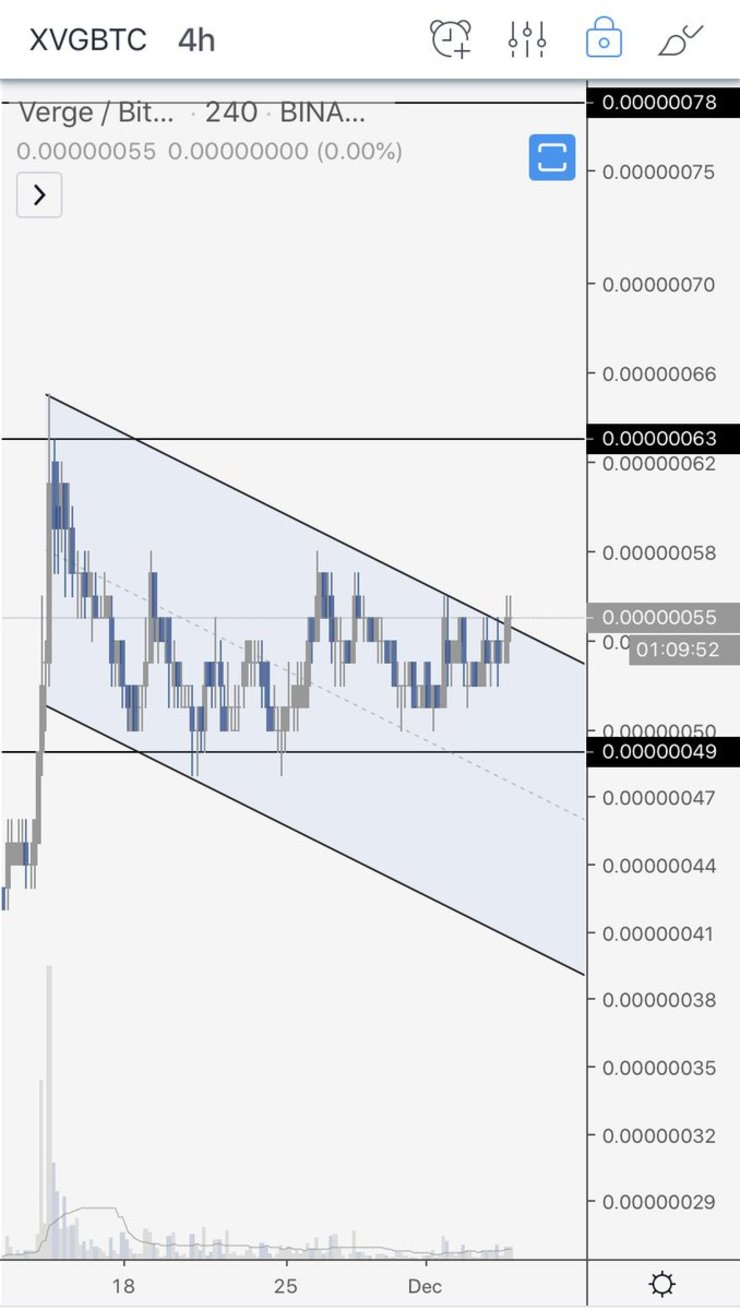
Like most altcoins, XVG dropped with MATIC yesterday, touching 54 sats. I am still presently in this trade but, like ZIL, failed to take profit at the first target of 63 sats.
ERD/BTC - 12/2/19 ENTRY
As I mentioned last week, I took a position in ERD at 26 sats but was unable to fit it in the last newsletter. Price has been moving nicely within an ascending channel and looks very bullish. I would consider adding more to my position with a strong flip of resistance to support at 35 sats. The MATIC drop yesterday also caused a drop on ERD, but the setup remains valid and may have given traders another chance to enter.
IOST/BTC - NEW TRADE
This is a straightforward trade. Price was forming a pennant at support (not shown) before the Binance shakeup. The MATIC move caused price to drop through support at 80 sats. I was watching for a bounce off of the blue ascending support, but saw price quickly drop through and entered at 71 sats, just above the horizontal support line. I want little to do with IOST below that line, or below the 70 sat support. I have my stop loss at 67 sats, as shown, because this would allow for a wick below that 70 sat support and close back above. This trade is VERY RISKY and current BTC price action may have me exiting dead even in the coming hours.
FUEL/BTC - NEW TRADE
I just took a small position in FUEL at 42 sats. There is potential exaggerated hidden bullish divergence on the daily chart, which means that price made equal lows while RSI made a lower low. This is not confirmed yet, but would be a sign of likely continuation to the upside. The blue ascending line is the main support that I will be watching for invalidation, although I would potentially release this if price goes below the red line, depending on general market conditions. All trades are RISKY right now.
What Happens When All Of The Bitcoin Is Mined?
The bitcoin mining process rewards miners with a chunk of bitcoin upon successful verification of a block. That is the simple explanation of what Bitcoin mining is. So what happens when all of the Bitcoin is mined and they can no longer receive the coin as a reward? This question has been hotly debated, most often driven by fear that the system could collapse.
This article offers a great hypothesis on what will happen and is definitely worth a quick read. In short, the sky will not fall.
"Even when the last bitcoin has been produced, miners will likely continue to actively and competitively participate and validate new transactions. The reason is that every bitcoin transaction has a small transaction fee attached to it. These fees, while today representing a few hundred dollars per block, could potentially rise to many thousands of dollars or more per block as the number of transactions on the blockchain grows and as the price of a bitcoin rises. Ultimately, it will function like a closed economy where transaction fees are assessed much like taxes."
"God Couldn't Outperform Dollar Cost Averaging"
You know by now that I am a fan of dollar cost averaging as an investing strategy for a majority of people. Using DCA eliminates the guess work and emotion from putting money away - you save a fixed amount on a fixed time frame, regardless of chart or price action. This is a great video that explains why this method is more powerful and profitable than attempting to time the dips for buying opportunities. Side note: this strategy does not generally apply to altcoins or riskier assets, but to strong assets that rise over time.
Interview With Beyond The Trades
I recently had the honor of being interviewed by the wonderful people at Beyond The Trades. We talked about previous failures, advice I would give my younger self (be less of an idiot!) and my favorite books. Another good read!
My Preferred Platforms And Tools
This is where I spend my days teaching and learning! Our Discord group is a one stop shop for everything you need to learn to trade and control your emotions. Feel free to DM me on Twitter or respond to this email for questions.
This is where I invest, commission-free. They now let you earn 3% interest on your Bitcoin held in Voyager, so you can compound while trading. Not only that, you’ll get $25 in free BTC when you download & fund.
URL: http://go.onelink.me/4gTR/ba4cd7d3
Rewards Code: WOLF25
I use RoundlyX to buy small amounts of Bitcoin every single day. They automatically round up my credit card purchases (with 10x multiplier) and invest them in crypto. Absolutely brilliant. Passively invest money you don’t need without a thought. Further, they have integrated with Voyager (see above) to offer commission-free purchases.
I use this platform more than any other and have the top tier account (yes, I paid). This is where I do all of my charting and TA and set my alarms to let me know when to check a chart. If you are not using TV, you are not a trader!
https://www.tradingview.com/gopro/?share_your_love=ScottMelker
Uncensorable .crypto domains (like scottmelker.crypto) that cannot be removed by hostile actors.
Gives us the ability to simply send Bitcoin & alts directly to a .crypto extension. Eliminates the confusion of long addresses.
https://unstoppabledomains.com/r/thewolfofallstreets
ESSENTIAL platform for doing taxes. I execute thousands of trades a year and they calculate what I owe accurately within a few minutes. It’s amazing and cheap ($29.95). They were kind enough to offer 10% off to my followers.
BlockFI is where I personally store part of my long holdings. They offer up to 8.6% annually, compounding, depending on the asset (BTC, ETH or GUSD), which is much better than any legacy savings account or investment. You can get $30 in FREE Bitcoin using my code once you deposit $100. Quite literally free money.
Code: melker30
https://app.blockfi.com/signup?ref=melker30
The views and opinions expressed here are solely my own and should in no way be interpreted as financial advice. Every investment and trading move involves risk. You should conduct your own research when making a decision. I am not a financial advisor.