


The Wolf Den #246 - What A Difference A Day Makes


Bitcoin Thoughts And Analysis
MONTHLY CHART
I have been sharing this chart for over a year. Bitcoin has been in a perfect ascending channel since 2013, with alternating touches up and down to confirm, and significant price action at the EQ (equilibrium, center dashed line) . A few months ago, Bitcoin flipped that EQ from resistance to support. Yesterday's price action retested that level as support. You love to see it.
WEEKLY CHART
It is too early to tell on the weekly chart, but absolutely beautiful reversal candle as of now. If the week closed today (it does not), we would have a massive hammer, with a small body and huge wick down. Any close even similar to this would be a strong sign that the bottom is in and price is ready to head back up. Also of note, but now shown, is that weekly RSI is right at 50, which is considered strong support and an area we have seen corrections bottom before continuation to the upside.
Here are the Fibonacci levels from the March 2020 lows to the 65K highs. As you can, price retrace more than 50% of the move (50% is NOT A FIB LEVEL, but commonly used) and almost to the infamous 61.8%. If we see another drop, that would be an important area, in the golden pocket between 61.8% and 65%. No reason price "needs" to go down there.
DAILY CHART
I have drawn fresh support and resistance levels on the daily chart. You can see that the 42K area is very important for the moment, as it was the high of the move from 20K and broke as support. We want to see that flipped back to support sooner than later. Otherwise, it remains a strong potential resistance.
Yesterday's daily candle closed 20% above the lows, pretty epic for Bitcoin. The long down wick indicates serious demand and we are seeing real follow through today. 42K may be the line in the sand, but for now this looks like a real bottom.
If price does drop again, I will be watching for a daily close below $36,780. That would likely give us an oversold bullish divergence on the daily, which would be epic. I am also watching the RSI resistance for clues of another major move up. If that is broken, price usually follows.
Daily is oversold on RSI, and significantly, for the first time since the March 2020 crash. This was necessary.
4 HOUR CHART
For the first time in recent memory, the bull divs on multiple time frames failed to predict a bottom. If you have been here a while, you have seen how powerful they have been in the past. Each bull div starting at 48K was followed by a hidden bearish divergence. No indicator is perfect, this has still been the best I have ever found for finding tops and bottoms.
Well, there was another 2 bull divs on the 4 hour chart, oversold, that confirmed yesterday. We need to keep going up and avoid hidden bearish divergence.
30 MINUTE CHART
I rarely zoom in this far, but sometimes it can give you insight on a huge move. Price formed a clear inverse head and shoulders and has broken the neckline. I would anticipate a retest of that black line as support. Volume confirms the pattern - you want to see noticeable spikes on the left shoulder, head and then breakout of the right shoulder. You do NOT need a spike in volume at the low of the right shoulder. We have the volume profile now, perfect. Target of this would be around 52K, but that's asking a lot! Either way, this is a clear bottoming pattern.
Altcoin Charts
It is almost possible to find "setups" on charts at the moment after the massive move yesterday. We need a few days for the price action to settle and see what patterns emerge. If you had bids just in case of a drop, you are probably WAY up today and enjoying the moment. That was the time to buy, but for now it's probably time to wait and see what happens. If you are looking for investments and not trades off of charts, I think you can definitely considering adding to your positions on your favorite coins for the long term.
AAVE/BTC
Update of a recent setup. Price dropped exactly to support and is currently forming a potential hammer that would signal a likely reversal. We also have a rounded cup, and appear to be forming a bit of an ugly handle. Either way, the rounding from the previous highs is bullish, we expected a rejection at the level and are now consolidating below resistance. Either you bought the dip or should wait for a break of the recent highs and price discovery.
AVAX/USDT
I shared this a few days ago, and nothing has changed. This is a large time frame bull flag or descending channel (a bit long for a flag. There is no trade here unless price breaks out of the blue channel, so this is something to set an alarm for and watch. The target is shown based on the length of the flagpole, and is dependent upon where the breakout happens. Also, log chart, hence why the target looks shorter.
ETH/USD
Epic chart, similar to what we are seeing on Bitcoin. This bounced almost exactly off of support at 1935 and is currently trading above the next support at 2646 that I had pegged as a good place to buy the dip.
Legacy Markets
COIN (COINBASE)
Like Bitcoin, Coinbase stock looks like it has potentially bottomed at least for the moment. Huge volume on the first hourly candle yesterday after the sizable gap down. There are a few gaps above that will likely be filled regardless, up to $257 or so. I will continue buying Coinbase as a long term investment.
A break of that descending line should confirm a reversal in the short term. I would expect some resistance there.
XAU (GOLD)
Quick reminder that the gold chart looks epic, with a clean breakout and retest of the descending channel. This should be heading back to at least $2000.
Analyzing The Crash From An On-Chain Perspective - IntoTheBlock
In this report, we bring to you the latest in on-chain cryptocurrency analysis. We look at the blockchain directly and analyze balances, transactions, and the overall activity of market participants. This gives us a unique insight into the future of the market.
This section is written in conjunction with IntoTheBlock (ITB). ITB is an intelligence company that leverages machine learning and advanced statistics to extract intelligent signals tailored to crypto-assets. IntoTheBlock tackles one of the hardest problems in crypto: to provide investors with a view of a crypto asset that goes beyond price and volume data.
The Wolf Den research team uses IntoTheBlock to dig deeper and get the most important insights about the crypto market.
Analyzing the crash from an on-chain perspective.
Yesterday we experienced one of the wildest days in crypto history. Driven by a confluence of bearish events such as a cascading of liquidations, news from China and of course the non-stop Elon Musk FUD, Bitcoin and all cryptocurrencies experienced a crash like no other.
In just one hour, the price of Bitcoin dropped from $39,000 to $30,000, from which it bounced almost immediately, going to $40,000. One thing important to note here is that the market composition changed dramatically over the course of the last 24 hours, as the number of leveraged players that got liquidated went as high as $8 billion.

These liquidations caused a cool-down in the futures market, as the Funding Rate in Bitcoin across major exchanges, which is a fee charged to perpetual swaps holders depending on the premium/discount and the positioning of contract holders, reached levels below 0, something that we haven’t experienced since the black Thursday of March 2020.

As of May 20 using IntoTheBlock’s Derivatives indicators
But let’s go a little deeper. As can be seen in the graph below, Bitcoin’s perpetual swaps volume yesterday was rising while open interest was falling. This trend suggests a substantial amount of long positions got liquidated over the past 24 hours.

As of May 20 using IntoTheBlock’s Derivatives indicators
And by taking a closer look into the Open Interest, we saw falling prices along with declining open interest, which suggests positions being closed. In this case, due to the spike in volatility, it is evident that several traders got liquidated in the last couple of days. Additionally, this points to weakening bearish momentum, as an increase in short positions would have caused open interest to grow as prices dropped.
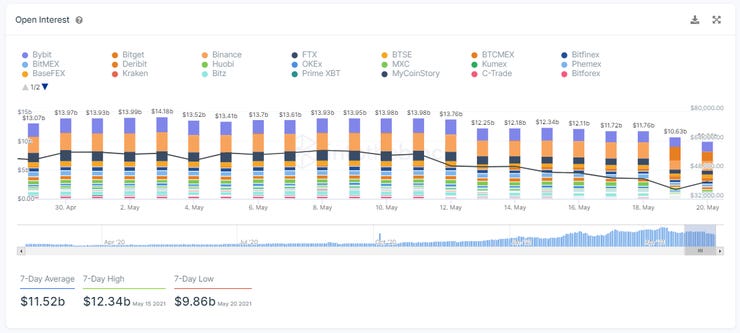
As of May 20 using IntoTheBlock’s Derivatives indicators
And as traders raced to unwind leveraged positions, it caused a major spike in Ethereum gas prices yesterday.

As of May 20 using IntoTheBlock’s DeFi Insights
Gas costs provide a view into how much Ethereum users are willing to pay for Ethereum blockspace. When there are high amounts of transactions, blockspace becomes more scarce thus making it more expensive for users to transact in Ethereum.
Yesterday, the Gas cost went as high as 1,321.63 Gwei in an hour, producing over $10.5 million in fees, the highest number ever recorded.
But who were the ones selling yesterday? Despite the recent massive sell off, IntoTheBlock’s Ownership by time held indicator shows that the number of addresses holding Bitcoin for over a year, which we classify as HODLERS, is at its highest level ever.

As of May 20 using IntoTheBlock’s Ownership Analytics
For a crypto-asset to accrue value it is important to have long-term supporters that are not looking to sell. And we saw yesterday short term holders selling at a loss by panicking, while the long term holders did not sell and even looked to increase their position.
Yesterday, IntoTheBlock's Netflows indicator spotted the largest ever inflow of $USDT entering exchanges. Recall that Net Flows are positive when more funds are entering than leaving exchanges.
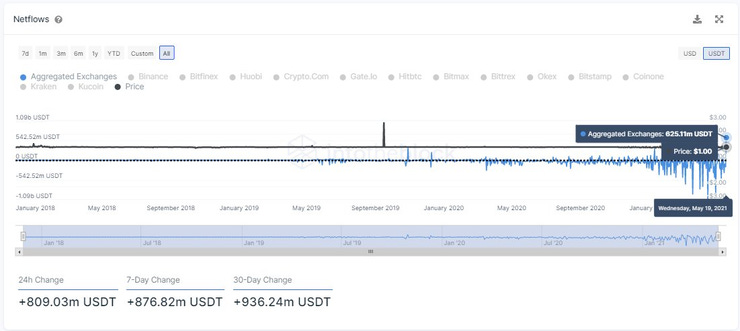
As of May 20 using IntoTheBlock’s Exchanges Flows indicator
Just in USDT, a total of $625,1m were deposited yesterday. Which coincides with the impressive rebound that we experienced yesterday.
Is the bull-run over? We think not.
Chart Requests
The charts were a mess yesterday after the crash, so this livestream was an adventure! Either way, you took it easy on me so I was able to do almost all of them.

Cathie Wood Predicts $500k Bitcoin
It’s hard to bet against Cathie Woods, the CEO of Ark Investments, considering her wildly successful investing record. When everyone is panicking, Woods is digging her heels in the sand and standing by her 500k prediction. In regard to Bitcoin’s recent crash, she said the following - “our conviction is as high.” In addition to her unshakeable Bitcoin position, Woods has added more $TSLA and $TWTR, two other unsexy buys that are currently on sale. As a final point, when she was asked about how low Bitcoin could go, she made a good point, “you never know how low is low when a market is very emotional.”
Perhaps more importantly, Wood asserted that a Bitcoin ETF is MORE LIKELY as a result of the price correction.
Anonymous 4Chan User Allegedly Predicts Entire Crash
4Chan, “an anonymous imageboard website” similar to Reddit, had a user post about an incoming massive dump coordinated with FUD to liquidate a major stakeholder. Almost everything posted turned out to be true, assuming this is real, which it appears to be. Below is the original comment word for word.
“Hey guys, insider here. For those of you that are not busy, there will be another announcement from China soon. Can't tell you guys what firm I work for, but it's MASSIVE and it's working with the PRC. The purpose of today's press release alongside all the FUD posting is to get BTC as low as it can get before 7am UCT. First, there will be a coordinated sell-off to drop the prices below a certain threshold and liquidate one certain stakeholder (can't outright say who he is but he bought a lot at the dip that he was partly responsible for). Once liquidated, the plan is then to buy up all the reserves and essentially leave him bankrupted. Once it happens, things are going to get green really fast (we project 70k)."
The thread included more posts from the original poster, and it freakishly predicted the events that have just unfolded. Anonymous users are always speculating major announcements, corporations buying Bitcoin, SEC and ETF announcements, etc. and most fail. With enough predictions, some are bound to be right by chance without reasonable foresight. That being said, the poster did potentially know ahead of time because the theory is a solid take on what could have just happened in the market. A move as sharp as the one we just saw wasn’t the result of only panicking retail, there had to be larger forces at play.
Alameda Research Explains Crash
In short - it was mostly because of leverage. But here are his points.
“The narrative in the winter was clear: institutions were getting into crypto and that’s why crypto rallied so much. This mostly happened in BTC, but the other coins mostly had a beta to BTC so they all rallied some, too.“
“More recently, the rumors turned to ETH. Now, institutions were getting into ETH, too!”
“Many alts reached all-time highs — some for these more fundamental reasons, and some from Elon-related hysteria.”
Despite “speculation that the rallies (especially the ETH rallies) were low-leverage and spot-driven,” all the volume was “in derivatives or spot where the exchange allows leverage.”
Funding rates for BTC perpetual swaps were “consistently between low + and really quite high + as new contracts got opened.”
Despite some people thinking that $ETH was going up over the past few months due to institutional investors buying it on Coinbase, the $ETH price was mostly being driven higher by traders buying “on leverage.”
All these leveraged purchases of $BTC and $ETH meant that liquidations were able to turn a small “reversion” into a big reversion.

Jenny DAO - Democratizing NFTs
Jenny DAO is a unique platform that is bringing the best of both NFTs and DAOs to create what they are calling, “The First Metaverse DAO.” This project first caught my attention as the platform began acquiring high-end NFTs from people like Steve Aoki, 3LAU, Tom Dwan, and more. You're probably wondering why it matters that Jenny Dao owns these NFTs? Well, they are setting up a DAO for users to participate in the democratization of a collective vault.
Using the Unicly Protocol, community members are given the opportunity to purchase, sell, and manage these coveted NFTs plus stake and yield farm along the way. The unique opportunity here is that instead of whales consuming these NFTs, taking them off the market for good, the community is now given the power. It’s like a museum allowing a trusted group of the community to own and manage all of the artifacts including what is displayed, sold, priced, and bought. Above is their website link, if NFTs sound interesting to you, this is a great chance to join an under-the-radar project without taking on all the risk of owning an expensive NFT.
Saito - Open Network For Web3
Saito is an open network layer that delivers web3 to users. Applications on Saito can run without closed plugins, private APIs and non-open infrastructure. Saito runs without an owner while funding the nodes that provide routing and user infrastructure for its own network and other public blockchains. All this is powered by an entirely new blockchain design - Saito consensus.
Saito consensus pays for what networks need to scale. By paying for nodes to collect fees from users and routing them into blocks, Saito consensus solves the biggest hurdle to open scaling - paying for large scale infrastructure. Saito is also more secure than PoS and PoW. Using collecting fees as ‘work’ eliminates the 51% and other economic attacks. [Link] Best of all Saito also has lower ‘gas fees’ as it is always cheaper per byte. Securing the network with routing eliminates payment for Mining or Staking, halving cost to users.
Further information:
Saito Arcade: saito.io/arcade
Whitepaper: saito.io/saito-whitepaper.pdf
Telegram channel: https://t.me/SaitoIO
Twitter: https://twitter.com/SaitoOfficial/
Medium: https://saitoofficial.medium.com/
Blog: https://org.saito.tech/blog/

The Wolf Of All Streets Podcast Ft. Plan B
With over 25 years of experience in institutional investing, PlanB migrated his skills over to the world of cryptocurrencies, creating Bitcoin’s famous Stock-to-Flow price predictive model. Praised around the world for its stellar accuracy, PlanB predicts that Bitcoin will hit $288K or even higher during the current cycle. PlanB’s confidence in the model is so strong that he believes the leading cryptocurrency is more likely to reach $250K or $300K than it is to plateau around $100k during this cycle.
In this episode, PlanB explores:
Market predictability
Supply-side shock
The Stock-to-Flow model
$288k Bitcoin
The fall of the dollar
A one hundred trillion dollar note
The cash and carry trade
The S2FX model
Being halfway through the cycle
A million-dollar Bitcoin
PODCAST SPONSORS:
---
Try Nexo’s full-suite, instant crypto banking service, featuring: savings accounts with up to 12% interest on crypto, stablecoins & fiat; flexible crypto-backed credit lines at just 5.9% APR; an exchange with 75+ crypto and fiat pairs and best-price guarantee. All this and more wrapped up in a single Nexo Wallet.
---
Learn about the Cosmos Hub and how the $ATOM can connect every blockchain. Cosmos is the port city connecting chains like Bitcoin and Ethereum to ensure your liquidity on any chain can be used anywhere.
Find new staking opportunities, applications, or build your own parachain here.
My Recommended Platforms And Tools
This is where I trade with leverage and can also trade spot with no fees.
This is where I spend my days teaching and learning! Our Discord group is a one stop shop for everything you need to learn to trade and control your emotions. Feel free to DM me on Twitter or respond to this email for questions. Code Wolfsden50%off for a 50% discount on the first month.
This is where I invest, commission-free. They now let you earn interest on your Bitcoin held in Voyager, so you can compound while trading. Not only that, you’ll get $25 in free BTC when you download & fund.
Rewards Code: WOLF25
I use RoundlyX to buy small amounts of Bitcoin every single day. They automatically round up my credit card purchases (with 10x multiplier) and invest them in crypto. Absolutely brilliant. Passively invest money you don’t need without a thought. Further, they have integrated with Voyager (see above) to offer commission-free purchases.
Rewards Code: WOLF
Concierge Phone Service for Americans that protects your from SIM Swaps and other phone related hacks. I cannot stress enough how amazing this service is.
Follow me on Twitter at @scottmelker. This is where I am constantly updating my trades and sharing ideas.
On-chain and fundamental analysis, research, predictions and indicators, all in one place. Highly recommend.
The views and opinions expressed here are solely my own and should in no way be interpreted as financial advice. Every investment and trading move involves risk. You should conduct your own research when making a decision. I am not a financial advisor. Nothing contained in this e-mail constitutes or shall be construed as an offering of financial instruments or as investment advice or recommendations of an investment strategy or whether or not to "Buy," "Sell," or "Hold" an investment.