

The Wolf Den #21 - Coin Requests

BTC - Quick Thoughts
Delete everything from your chart. There's only one line that matters now. A break of this line would be the first macro higher high since the 14K top. Movement above and a flip to support would effectively end the "bear market" argument. Higher high = confirmed bull trend. The red line.
RSI is currently overbought on the daily with a potential bearish divergence (red arrow). We want to see a significant push up before the daily close to invalidate this bear div. Also, want to see a CLOSE above the red line, not a wick. A wick would make a bearish SFP (swing failure pattern). This would indicate that selling liquidity was found and price should drop - a top signal.
This is the moment we've been waiting for which will determine the foreseeable future for Bitcoin, in my opinion. This also means alts are at resistance and a bit riskier.
Ideas (Not Repeating Tuesday's, Which Are Still Valid)
NEO/BTC
Here is the tweet that I fired off about this last night. This is my favorite set up right now as a longer swing trade.

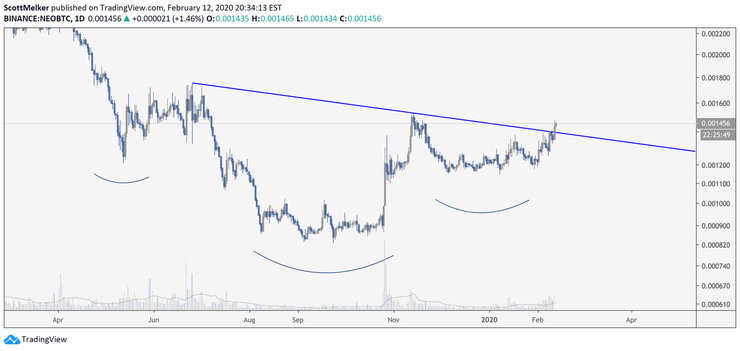
Note, this could form a cup and handle now, which would have a bit of retracement to make a handle. Also, it could come back to test the blue neckline of this Inverse Head and Shoulders. It could also make an SFP (swing failure pattern) above the black line. That said, the macro IHS rules in my opinion, so I would be all over this now and just aware that there could be a little retrace. I would NOT BE SURPRISED to see this go straight up from here and would not personally want to miss it. My strategy is to set a bunch of buy orders so that I would at least catch some of it if it rockets.
XRP/BTC
This looks so bullish. Price finally flipped that key grey area of resistance into clear support and blasted off on very strong volume. This could really moon if Bitcoin allows it. Target is at least the top of the descending black line.
Chart Requests
ACB (AURORA CANNABIS) (2/12)
Not much to like here. This stock has been in free fall and recently gapped down as a sign of weakness. It is trading below EMAs and most resistance. That said, it is at key support now, so I could say taking a shot on this with a tight stop loss below the blue area.
AION/BTC
AION had a huge pump, which we all rode for great profit. It peaked in volume at the top and volume has been dropping ever since. Price is still above the key blue support area and is bouncing off of the 200 EMA - this could be a bottom, but more downside would not surprise me either. Volume generally drops during consolidation, so that's not a huge concern. But that bullish action is over, so we are looking for a renewed push. Breaking the blue descending line would be a sign that bullish consolidation is ending and there's more upside coming. I would watch to see how this daily candle closes. A bullish hammer like it is showing now would be positive.
COS/BTC (2/12)
Looks like it is starting to reverse. Price is approaching strong resistance at 112. This is also presently in confluence with the descending blue line that will also likely act as resistance. Crossing those and flipping them to support would be bullish.
DAG/BTC (2/12)
This chart is no less ridiculous than it was last time I looked at it for someone. Death cross of the 50 and 200 EMAs looking likely, price really has not moved at all and there is almost no volume. Gaps all over the chart. I could not trade thism, personally.
DBC/BTC (2/12)
Simple chart, really. Real bullishness should start with a break of the descending resistance and then a flip of the horizontal black line from resistance to support. Set alarms on the lines and go about your day.
ETC/BTC
ETC looks like it could be readying for further movement up. It is sitting on key support now, so there's decent risk/reward to try a position here with a stop below the recent lows. As you can see, there was a clear overbought bear div with RSI that signaled the top. At present, there's a lot of potential hidden bullish divergence, which signals likely continuation back up and the "end" the bear div. This looks good if support holds.
ETH/USD
Price is presently parabolic, but is at a level that a retracement would be expected and healthy. As you can see from the Fibonacci levels, we have a "golden retrace" of the entire move down from $364 to $116.25. Price is trading above all EMAS, with a goden cross of the 50 (blue) and 200 (red) confirmed yesterday. If you have been following me, you likely bought this on the breakout of the descending channel around $143. Side note: never a bad idea to take profit at resistance - even if just a small part of the position. The 61.8% fib here is strong.
FB (FACEBOOK) (2/12)
Facebook looks like it is gearing up for a similar move as Amazon. You can see my Amazon chart in the last email for reference. Cup and handle continuation pattern and price testing all time highs. Key support is the ascending black line. If this breaks the all time high. It could really fly and fast.
FTM/BTC
FTM is presently at a key resistance level at 118. Flipping 118 to support should lead to a move to 134. Key levels are marked. Price needs to break the descending line to exit the present down trend. It needs to hold the ascending blue support to remain bullish. Simple.
GBTC (2/12)
This is the Bitcoin chart's cousin. Similar bull flag, same movement. Everything above 12.05 looks good to me - I would set some orders there in case it comes back to test it as support. All things Bitcoin remain bullish in my opinion, even if we see some significant retracement.
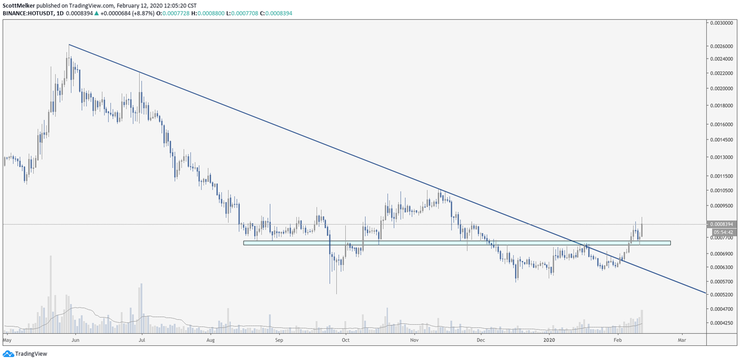
HOT/USDT
I tweeted about this yesterday - pretty much sums it up! Fibs line up perfectly (as they often do!) with levels I would draw as resistance and support. Use those as targets.
INS/BTC
Above red = good. Below red = bad. Pretty straightforward. Local support is the rising black line. Any touch on that could be a decent entry, but I would watch for a break above red and flip to support, personally.
IOTA/USDT
Bullish consolidation above a key support. Price is presently confirming a golden cross between the 50 EMA and 200 EMA (in the green circle). Bullish. Price retraced the entire move down back up to the 50% level, which is generally strong resistance. Consolidation here is expected, loading up for a potential move to break that area. Volume has been rising steadily for weeks. This still looks good generally above the black line. Fibs make good targets.
LINK/BTC
Careful. While LINK remains parabolic on a local level, price hit the all time high (purple) and was rejected. This could definitely keep going, but for now we have a bearish SFP (swing failure pattern) above the all time high, which would indicate a ton of selling interest at that level. Yesterday's candle confirmed with the wick above purple. If today closes with another wick above that level and no close, I would personally be taking profit and letting this go - either for a lower entry or to enter again on confirmation of the break on a support flip.
LSK/BTC
Crazy chart. Key levels are marked, but that epic wick up a few days ago was definitely a signal that the uptrend was concluded. Huge selling volume.If price closes the day below 1839, I would expect to see it visit the next line down, around 1434. A close above 1839 would make a nice daily hammer and should see price rising again. Watch the daily close if you are trading this.
MPLX (2/12)
What a daily candle. Price moved slightly below support, created a dragonfly doji then printed an epic bullish engulfing candle on strong volume. Price bottomed right at the S1 pivot as well, strong support. This should see more upside. A break of the top black line would confirm a potential double bottom. That would be a big move.
NEO/USDT
This has been bullish for a while and still looks good above the black line. That said, like many other alts, this has retraced back up to the golden pocket of the entire move down. That is historically strong resistance, so I would remain cautious. This pair will move based on what Bitcoin does here at resistance as well. For now, still looks good.
NEXO
Careful. Right now price was strongly rejected at resistance (the blue box) and is forming a very ugly shooting star. A daily close like this would signal a pause at the least, but could also be the top of this move. I definitely would not be entering at this point unless it was lower on a retrace, or above the blue level.
ONE/BTC
Price appears to be in a large descending channel (blue). It just flipped the center line (EQ) to support, which is encouraging. Local support is the ascending blue line. A break above 68 and flip to support would be very encouraging. I like this as long as it holds that ascending blue line and channel EQ.
QNT/BTC
This is trading in a range (blue) and was rejected repeatedly at the top, with wicks above the top. That's not great. That said, a bounce from the dashed center line (EQ) could be a decent entry. If not, the bottom of the range. For me, I would trade this only above the range, flipping the top to support. Also, there's a larger blue descending wedge, so the real bullishness does not start until a break of the top blue line.
QTUM/BTC
Like with many coins, this is at key resistance. It is the top of the local trading range, as well as the drawn light blue box. A flip of this area to support would be very bullish and would be my preferred entry. You can see that price found support on the 200 EMA after breaking it. Both EMAS (50, 200) are currently curled up and a golden cross looks likely.
RDN/USD
RDN has broke it's down trend (blue line) and made a strong move away. That is bullish. However, there is a key resistance (black line) ahead. At this point, I would prefer to see a flip of that line to support for an entry. Fib levels shown are targets of the move up.
SC/BTC (2/12)
Ranging, but just made a move above the EQ (equilibrium, dashed center line) of the blue trading range. That's bullish if it holds. Key resistance at 25 sats - a flip of this should lead to at least 30. A break of 30 would be a break of the trading range, as well as a confirmed double bottom (a double bottom is confirmed when price breaks the swing high between the two bottoms). This would be very bullish. Descending blue line is additional resistance.
SPCE (VIRGIN GALACTIC)
There is, quite literally, no way to chart this. Have fun trying to figure out where this one is going! Absolute monster move, no sign of stopping. Nothing on a chart can help us here, completely up to the market. I can't even find a line worth drawing.
THETA/BTC
LOL. I believe there was some news yesterday that sent price flying, but clearly it was dropped back down and stopped right at a key resistance. A close below 1564 today would be VERY ugly, a massive bearish SFP. Any close above that and retest as support should see price continuing up. Price clearly broke the trading range it was in, so this is looking good.
TOMO/BTC
Above pink is good, below blue is bad! I would love a break above pink and retest as support. A break of the large descending white line would be the real signal that this is targeting all time highs. For now, looks decent.
XLM/BTC
As always, when XRP moves, XLM seems to follow. Like with many of these setups, price was rejected at a key resistance so we need to watch and see what comes next. Really bullish movement through the ichi cloud and resistance though, not much to dislike here. I would not be surprised to see price come down and test the top of the cloud and that black support line that's right in that area.
XRP/USD
This still looks bullish. I love the BTC pair at the moment too, which I shared in "my trades." I tweeted this yesterday.
That move came - there was no reason this would not follow the other majors. For now, I really want to see it hold .31533. Macro target is the top of that black descending line. One step at a time.
XTZ/BTC
The gift that keeps on giving. As I mentioned, when I was hacked my orders on exchanges were canceled, causing me to miss my entry in that circle. Very annoying. Any movement above the all time high at 2571 remains bullish. A retest of that area would not surprise me. The daily candle is far from finished, but the long wick down can be interpreted two ways, depending on your bias. One - strong demand, all dips being bought up. Two - from a Japanese Candlestick perspective, it would look like a hanging man if it closed here, which is actually bearish. Not relevant unless followed by another bearish candle tomorrow.
ZEN/BTC
I did not have to change anything from my previous analysis. Looks good. Flipped the black level to support and has remained in it's ascending channel - also tested the bottom of that channel as support. Exited the descending wedge (blue lines) and retested as support as well. Really looks good.
ZIL/BTC
I personally would not trade this until it flips 92 to support. It was rejected there last time in ugly fashion, leading to a trip down to the next support. The 57 area was the right entry if you were looking to buy support. Now it is in no man's land.
ZRX/BTC
Another coin that hit key resistance and was rejected. Movement above 3096 would be bullish to me, which would also flip the 200 EMA to support. You can see that it offered strong resistance on the wick up that tested it. Volume continues to rise, so this is generally bullish.