

The Wolf Den #14 - BTC, Alts, Legacy Markets, News And Lessons!

BTC Thoughts And Analysis
Bitcoin dropped a bit on low weekend volume, causing the trading community on Twitter to go into a panic and start calling for $5,000 Bitcoin, lower lows and a renewed bear market. Par for the course. I was stopped out of my $7,700 buy on the drop, closing at $8,960. Another huge win. I placed my stop below the $9,000 psychological level. In the same fell swoop, I filled a series of orders that were already placed, averaged in at $8,540. I remain in this position.
Let's take a look at what the charts are telling us.
MONTHLY CHART
Nothing has changed on the monthly time frame. Price broke cleanly through the $7,777 level and has reached the next key area - around $9,090. There is a strong confluence of resistance in this area, so breaking through will require conviction and volume. As always, this candle still has quite a while until close, so it is only an idea and nothing is confirmed. There is no more simple way to play long term Bitcoin moves than by simply using these lines on the monthly chart. Price is also trading above all relevant EMAs.
WEEKLY CHART
Still my favorite time frame for watching Bitcoin. Last week's candle was looking primed for a strong break of the descending channel until the final 12 hours of the candle - proof that we have to wait for confirmation on a candle close to react. Price ultimately wicked above and closed below - shame! That said, price has now exited the channel sideways on the weekly, with 5 days remaining until candle close. I am watching for heavy volume and a move up from support (the descending channel top) to signal that consolidation is ending and a new bull trend is potentially starting.
Price is trading well above all EMAs on this time frame, and they are curving upward. This is a bullish signal. You can see my full analysis of the weekly chart and how I bought the dead bottom in this Twitter thread, or previous newsletters.
Weekly MACD is about to turn bullish for the first time since August, which also adds confluence to the bullish narrative. That's the only part of this article I endorse!
DAILY CHART
One line to rule them all - the black line. It is very clear by reducing the noise on the chart that there is one key area that determines the break from bear to bull on the daily time frame. This area (lines are elastic, they should be viewed as zones) needs to be flipped to support before I view this as a true bullish trend.
That said, for now there is nothing immediately bearish, in my opinion. The red line is the key local support and price reacted to it like a champ. Price action above the red line indicates that the local bullish trend is not broken.
As mentioned in previous analysis, BTC was rejected at the R3 pivot on the daily, which is in confluence with the resistance line drawn. As predicted, price found support on the R2 and began further movement up. Price is currently ranging between these pivots. A break above the R3 would technically signal continuation, while a break below the R2 and flip to resistance would be a good short opportunity for traders that use this indicator.
Daily EMAs look bullish. The 21 EMA has crossed up both the 50 and 200 EMA, the latter confirming yesterday. All EMAs are pointing up.
SIDE NOTE - I prefer to use EMAs over MAs, because they are weighted more heavily towards recent price action. Neither are a huge part of my trading system.
This is the most bearish element of the chart for me at the moment - a slight bear div with RSI on the daily. I would like to eventually see a bull div of some sort form to negate this idea. That said, divs in trending markets can often be stopping points rather than reversals. Watching closely.
12 HOUR CHART
As you likely know, I view golden and death crosses as lagging indicators that occur as a result of movement in the past and do not tell us much about the future. That said, the 12 hour 50 EMA has crossed up the 200 EMA. This is a classic golden cross between the two most commonly used EMAs. This time frame also shows three wicks down to the 21 EMA, with this line acting as clear support on each. This chart was posted yesterday, when the golden cross was confirmed. You can click the link and push play to advance the chart, as always.
4 HOUR CHART
There were bearish divergences with RSI on every time frame below the daily that preceded the drop, shown in red. That said, a hidden bullish divergence has confirmed on the 4 hour chart, which signals the end of the bear div. Now we are sideways and waiting for the next move.
BITCOIN DOMINANCE
Disclaimer - charting Bitcoin Dominance is a bit ridiculous! That said, if you are a fan of looking at this like a trading asset, it's sitting at 2 key support levels and looks likely break down. What has a breakdown of Dominance meant in the past? Alt season. Watch for a break of ascending black support and horizontal purple support for a sign that Dominance is likely to drop further.
TexasWest Capital
"If you are the smartest person in the room, you are in the wrong room." I have learned more in the last 3 years from Christopher Inks than in all of my other years trading combined. I was a PAYING member of his group from day 1 and eventually convinced him to take me on as a partner to admin his Discord group. This is the only Discord where I engage. He is truly the best teacher, mentor and trader that I know, so I asked him to share the following article about trading in general and about TexasWest Capital. Enjoy.
Retail traders have always generally come into the markets with misguided thoughts about how rich they can become, seemingly overnight. The minute they start down the trading rabbit hole, they're inundated with ads from scammers trying to sell "systems" that take "no effort" or "minutes a day" to employ and make it appear that they will produce six and seven figure incomes year after year. This preys upon the casino mentality new traders generally have and leads those traders to subconsciously overstate what they can make, and how fast, while understating what they can lose, and how much faster it's likely to happen.
It's human nature, so the good news is that by this measure you're not special (it means you don't have to be so hard on yourself because you are doing the same thing everyone else does). However, that doesn't mean that you can continue doing what you've done and expect to reach your goals. Traders that remain in the market for a year or more invariably conclude that risk management is the absolute single most important thing they will ever learn as traders. The truth is that your lack of control over your emotions, compounded by poor/no risk management, contributes more to your account drawdown than anything else. And it does so by a very large margin.
No matter how good you get at drawing lines on the chart, you will never be a consistently successful trader until you address your poor emotional control and correct your misunderstanding of the psychology of markets. Being a new trader, your goal is simply to survive until you get enough market time under your belt. But you can't do this unless you take risk management seriously. Proper risk management allows you to protect yourself from the mistakes you WILL OFTEN make as a new trader. This way your capital is protected as you get better (i.e. more wins, more often, with less drawdown). It will NOT happen overnight. Trading is a skill and, as such, takes practice and repetition to develop, just as any other skill. Thankfully, you can learn how to trade. It is not rocket science and does not require that you understand SEC filings, accounting, or any other business fundamental.
It is from this premise that we position ourselves at TexasWest Capital. Having spent the past 25 years successfully trading stocks, FOREX, and options, I noticed a glaring need for what we do when I entered the cryptocurrency space and was immediately hit with all the pump and dump schemes, commentary masquerading as "technical analysis," and emotional decision-making that was being yelled the loudest in social media, usually by someone with a fake name and cartoon animal picture, often drowning out the true nuggets of info that new traders need. Retail traders have a plethora of information available to them online but no idea how to sort through the fluff and nonsense in order to find the real, tangible, actionable commentary that will add to their success rather than detract from it.
We have been in business for more than 2.5 years and still have many of our original members who continue to remain with us precisely because of our approach. New members can now access our trading lesson series which takes them from market basics, psychology, and risk management to more advanced trading methods like Wyckoff, as part of their subscription while paying 50%-75% less than we have ever offered it before. Additionally, members get access to our daily updates across multiple markets including cryptocurrencies, stocks, FOREX, metals, and oil. I have called both stock market tops publicly over the past two years, months before they occurred. I called the Bitcoin top a week before it happened, the ~$3100 bottom once it hit and everyone was saying it had to go lower, the ease with which Bitcoin moved through $6000 on the way back up, the top in June 2019, and the recent ~$6400 bottom. How much money could you have made buying and selling with us? But this only the beginning.
You may have seen some of my charts floating around social media the past few years. I said gold was a buy in November 2018, silver was a buy in October 2018, long before most took notice. I outlined the December 2018’s 1000 pip USDJPY drop a few weeks prior to it happening. In Q4 2018, I stated that the US Fed would not be raising interest rates in 2019 although they said they would raise it 5 times (and they didn't raise it). Many of our members have had great success trading everything from stocks, to cryptocurrencies, FOREX, metals, oil, and so much more, and they’re always willing to share their knowledge and discuss new approaches to the markets!
In addition to daily and/or inter-day updates for BTC, BNB, EOS, ETH, LTC, XRP, AUDUSD, EURUSD, USDJPY, Gold, Silver, Oil, and DJIA, we provide numerous trade opportunities for our members. Last week's published stats -
Cryptocurrency set ups:
PHBBTC - up 5%
BATBTC - up 20%
MTLBTC - up 40%
Equities set up:
CGC - LONG is up 9%
------------------------------------ ------------------------
BYND - published 1/8/20 at $81.48 and price hit 60% profit on 1/14/20, surpassing our mid-level target of $125 by $10
------------------------------------ ------------------------
FOREX:
AUDCAD - 20 pips SHORT profit over night with 29 pips possible; next entry is currently setting up
CADJPY - -10 pips UNREALIZED LOSS overnight so far but is within my SL for the time being. Should ultimately be profitable with large target still valid.
I can't promise that you will become a trading savant. But I can promise you that if you take it seriously and treat it like a business, rather than a casino, learn how and why the markets move like they do, remain humble and always strive to improve your risk management, that you will be light years ahead of most of the retail traders you come across. You will have a chance to be successful -- to build your wealth over time.
We would love to be a part of your success, so make sure you tune in to youtube.com/TexasWestCapital on Tuesdays and Fridays at 10 a.m. CST for a free live stream, follow me at https://twitter.com/TXWestCapital, and be sure you join our Discord at patreon.com/TXWestCapital.
Altcoin Trades
Altcoins have continued to thrive as Bitcoin has settled in and started to move sideways once again. As you know, Bitcoin can cough and ruin any and all of these setups. That said, this has been a great time to trade alts - if your risk is managed than you can have at it. Just make sure your stops are in place and that you are not overtrading too many setups - 20 trades taking 1% losses will blow up your account!
ADA/USD
Bullish movement for ADA against USD. I entered once again at the upper blue line, a bit late considering the strong break of descending resistance. That said, I would consider adding to my position if the upper black line is flipped to support. I am watching for a daily close above that black line - I will then set orders there (slightly above) to hopefully catch that flip to support.
BAT/BTC
I took a position in BAT at 2320, the purple line. My first target is the top of the black descending wedge, a bullish consolidation pattern. That said, the safest entry would be a break and retest of the top black line, so I have my alarms set in that area. My goal here is to give you an actionable trade if it happens in the future.
EOS/BTC
I really like this setup, and have also been trading the USD pair as discussed previously. Price exited the blue trading range on strong volume and has successfully retested as support. This entire area could be a good entry. First target is the red supply zone, but a flip of this could lead to a serious bullish move from EOS.
HOT/BTC - ACCUMULATING AT 7 SATS
I have been in HOT for quite a while, starting at 10 sats. I have continued to buy lower and have an average entry now of between 8-9 sats - slightly underwater but reasonable. As you can see on the weekly chart, price is ranging (blue) and continues to tap the all time low at 7 sats. This is where my orders have been filling. Price broke the prevailing down trend (descending channel) and has bullish divergence with RSI (not shown) on multiple time frames.
Low sats are often the last to move, so this could take a while to build. But I have made most of my huge trades on low sat coins in the past and am willing to take a shot on setups like this with a longer timeline in mind.
LINK/BTC - 1/20/20
As I have mentioned in multiple previous emails, I am very interested in trading LINK. My first entry was at the purple line at 26710, when price retested the descending blue resistance and the horizontal support. Price moved up nicely, never leaving my position in doubt.
Price has now consolidated in a bull pennant and has broken resistance. I added to my position here. You can see a closer look in the tweet below.


TRX/BTC
I shared this trade idea in the very first issue of The Wolf Den and it finally broke resistance. I entered at 186. I had this setup lined up to show you the red line, but it has broken up before I had a chance to publish. This is a nice resistance to support flip. At this point, I would personally wait for a clear break of the local purple descending resistance. Target of this trade would be at least the top of the wedge, in theory.
XMR/BTC - 1/20/20 UPDATE
I entered XMR at 7739 when it recaptured the horizontal line as support and broke descending resistance. It was an absolute fake out - it happens! I am now watching once again as price consolidates against both the descending and horizontal trend lines. I remain in, but if I was looking for a fresh entry, it would ideally come in the form of a candle closing above resistance and potentially a retest as support. Either way, this looks quite ready to explode if it can break through resistance.
XTZ/BTC
Beautiful. As discussed previously when I posted the entry, price broke the descending line and rode it down as support. It finally popped up on volume and is now flipping the next key level from resistance to support. This can potentially be traded from level to level, all of the way to the top of the descending line.
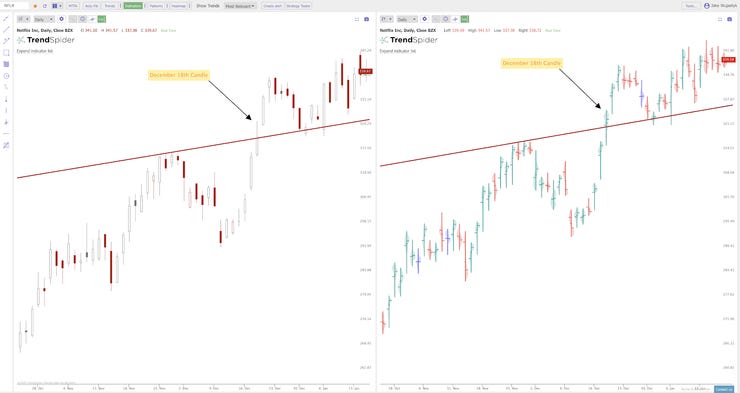
TrendSpider - Optimized And Automated TA
I have been testing this platform out over the last couple of weeks and have been blown away by some of the unique features. This would be particularly useful for beginners, as it can help automate some of your charting. Here's the skinny:
TrendSpider is a new charting software created to optimize the process of technical analysis through automation of certain processes to help complement your discretionary views. TrendSpider also has multiple other layers to the platform including new ways to visualize volume flow and volume profile, as well as create logical conditions to test without the need for coding. Here is a video with some case studies, as well as some images and descriptions below showing the power of this platform.
TrendSpider Case Study #1: Visualizing Volume Flow With Raindrops
This particular case study shows how you can visualize how volume is flowing throughout a candle and see where buyers and sellers are within wicks and bodies when comparing to a regular candle. See the video for more details and explanation!
TrendSpider Case Study #2: Anchoring The Volume-By-Price To Find Demand Levels


This case study focuses on the anchored volume profile creating a new base for price to bounce off of towards new highs. See the video for more details and explanation!
TrendSpider Case Study #3: Using The Anchored Volume Profile To Find Supply Zones Above


This case study focuses on the anchored volume profile showing a lot of volume holding above which acted as a level of supply (resistance) once price got there. See the video for more details and explanation!
Sign up for a free trial of TrendSpider here!!!
Use code WOLF15 for 15% off for up to 12 months.
https://trendspider.com/?_go=wofas
Legacy Markets
AMAZON (AMZN)
If you have been following me for a while, then you likely know that Amazon is one of the few investments that I have been dollar cost averaging into for years. I have bought this at almost every price, which has been an extremely profitable strategy. I believe that this company will continue to take over the world.
That said, I also trade it from my trading portfolio and have been aggressively doing so once again over the past months. My biggest buys were on the major dip at the end of 2018, for an average entry of under $1,400. Amazon has been trailing the market a bit over the past few months, not growing as fast as the Dow as a whole. I find this encouraging, because the cream generally rises to the top. The weekly chart shows a cup and handle, which is a classic continuation pattern. The cup is a bit less rounded than I would honestly prefer, but the general shape, move back to nearly the all time high and subsequent bullish consolidation (descending channel) seem to fit. Price has broken from the channel (handle) in the past few weeks. Price should first target the all time high, and then theoretically make a move to $2,750 based on the depth of the cup on a log chart.
GOLD (XAU)
From a technical perspective, gold looks like it has topped out a bit at a key resistance on the monthly chart. Price is showing a potential bearish divergence with RSI on this time frame in overbought territory. This div is more pronounced on lower time frames, but is yet to confirm. I am personally looking at the two boxes I drew to add gold positions, if it happens to retrace (no guarantee it will). The center of the ascending channel and the previous resistance flipped to support are the reason I am watching those areas. That channel is not technically valid, because it lacks two touches on the top - but it's still a general idea of price movement that fits for me.
Ignoring the charts, gold saw a predictable rise when the United States and Iran seemed to be on the brink of war. Gold is viewed as a safe haven asset, and tends to rise in times of global turmoil. Now that things have settled, a further drop would not be a surprise.
NETFLIX (NFLX)
I wrote this up as a chart request for someone, but figured I would share it since it is one of my personal positions. I also added a bit more analysis.
Netflix is one of my biggest holdings. I am up over 300% on my entry, which I took when it dropped massively for no rational reason the day that Brexit was first announced. I bought the dip hard and was up 15% within 2 days. That is my favorite kind of trade in the stock market - a day when everything drops, but the fundamental value of an individual company is unchanged.
Technically still looks bullish to me. It is ranging, but also forming a bull pennant. Price is trading above all relevant EMAs, all of which are now pointing up. The 21 EMA is about to form a golden cross with the 50 EMA. I am fully deployed on this for ages, but would consider another entry on a clean break of the pennant, or a retrace to the bottom support. As far as the range is concerned, all price action above the EQ is bullish.
USD/JPY
I only take very long swing positions in Forex markets and this is one of the few pairs that I have been focusing on for a long time. The break down of the red ascending wedge was one of the best trades of my life, provided to me by my friend Chris at TexasWest Capital. I rode this to the bottom of the sizable wick and then stopped trading the pair for many months. I reentered in the circle after price formed a clear bullish SFP below a major previous swing low (the start of the red wedge). I rode it all of the way up and closed when it hit the blue box. That said, I am interested in taking a new position now that this area is flipping from resistance to support. As you can see, the R2 pivot is providing strong resistance, so I may wait until a break above to catch a safer trade higher up. Use this as you will.
Mind The Gap: Identifying 4 Different Charts Gaps
The talk of the crypto community in the past few months has been the gaps on the Bitcoin CME (Chicago Mercantile Exchange) futures chart. Bitcoin trades 24/7 on major exchanges but does not trade on weekends on the CME. This often creates a gap, or empty space on the chart when trading resumes on the CME.
There is a famous saying in Physics: “nature abhors a vacuum.” This is a postulate attributed to Aristotle, who articulated a belief, later criticized by the atomism of Epicurus and Lucretius, that nature contains no vacuums because the denser surrounding material continuum would immediately fill the rarity of an incipient void. People have expanded the concept to apply to many facets of life — including trading and technical analysis.
A gap is an unfilled space or interval on a chart, caused by sharp movement in either direction. In an upward trend, a gap is produced when the highest price of one candle is lower than the lowest price of the following candle. Conversely, in a downward trend, a gap occurs when the lowest price of any candle is higher than the highest price of the next candle.

There are four types of gaps and they are traded in different manners. It is essential that investors be able to differentiate between them.
Breakaway gap — This gap is seen when price makes a strong directional move from an area of consolidation. It is particularly powerful for traders when combined with clear patterns on the chart like trading ranges and ascending and descending triangles. A breakaway gap with significant volume after the gap is a sign of a strong trend and is unlikely to be filled. A low volume move creating the space is more likely to see price returning to the area. Bottom line — breakaway gaps are less likely than other types to be filled.
Common gap — These are also known as area gaps, pattern gaps, and temporary gaps. These are the gaps that traders see most often in trading ranges and during sideways movement. They are often filled but offer very little information on what price is likely to do after this occurs. They rarely exist within a notable price pattern on the chart — they are simply areas where there was minimal trading that is likely to be filled.
Exhaustion gap — This type of gap is viewed as a signal that a trend is ending and that a new pattern or trend is likely. They occur near the end of a price pattern and signal a final attempt to hit new highs or lows. Exhaustion gaps generally occur in an area of rapid advance or decline, often on a large move straight up or down. They are normally preceded by a heavy volume spike and often foreshadow a “blow-off top” in an uptrend. These are the most likely gaps to be filled.
Measuring Gap — also known as a runaway gap or continuation gap these gaps occur in the middle of a price pattern and signal a rush of buyers or sellers who share a common belief in the underlying asset's future direction. Measuring gaps do not occur during consolidation or in an area of congestion. They occur during a rapid price incline or decline. Runaway gaps are not normally filled for a considerable period of time, if ever.
A common mistake when trading gaps is confusing exhaustion and measuring gaps. This can cause an investor to position himself incorrectly and to miss significant gains during the last half of a major uptrend.
Keeping an eye on the volume can help to find the clue for discerning between measuring gap and exhaustion gap. Normally, noticeable heavy volume precedes the arrival of an exhaustion gap.
Exhaustion and measuring gaps predict moves in opposite directions, so it is essential to understand the difference. Also, it is important to note that once a gap starts to fill, it rarely stops — because there are no immediate areas of support and resistance within the gap.
The bottom line? Measuring gaps and breakaway gaps are far less likely to be filled than exhaustion and common gaps. Understanding the difference between the types of gaps can help traders and investors make money in every market.
US Congress Proposes Tax Free Small Transactions
This is encouraging. As you know, every time an American uses a cryptocurrency it is a taxable transaction. If you buy a coffee at Starbucks with Bitcoin, you have technically "sold" that Bitcoin. This law would change that, making Bitcoin and other crypto far more attractive as a form of money. Any transaction under $200 would not be taxed. Let's keep our fingers crossed that they consider and pass this reasonable measure.
$450,000,000 Bitcoin Moved - For $.25!
"Yesterday, Twitter accounts tracking notable transactions on the Bitcoin blockchain and other blockchains noticed something interesting had transpired: over 50,000 BTC, valued at around $450 million as of the time of the transaction, was sent from one address to another.
The transactor paid $0.25 — yes, a single quarter, which really can’t get you anything in and of itself in the Western world — to transfer hundreds of millions of dollars worth of Bitcoin from one address to another."
This is ASTOUNDING and displays that there is a true and meaningful use case for Bitcoin. Imagine how difficult it would be using traditional means to send 450 million dollars from one bank to another. Now imagine the associated fees? Using Bitcoin, someone was able to do this, effectively for free, without the intervention or permission of a central entity. Bitcoin solves this.
The United States Holds Iraq's Money Hostage
This news came out over a week ago and hostilities have dramatically reduced, but this is still worth discussing. The United States has informed Iraq that it will lose access to it's most essential bank account if they ask The United States to pull out of their country.
Let that sink in. The United States invaded Iraq decades ago on false pretenses (nonexistent WMDs), has set up shop and is now refusing to leave. Further, the US nearly started a war with Iran on Iraqi soil.
Whatever position you have on the various wars and agendas in the Middle East, it's hard to argue that a sovereign nation should not have access to their own money. The US Dollar has been weaponized for decades to keep enemies and friends alike under control. The US has a long history of using the FED, World Bank, IMF and private corporations to control the money supply of foreign entities, both through brazen acts of holding the money hostage, and through offering massive loans that are impossible to pay back. The present situation is just one instance of a long standing policy of control and manipulation.
To offer a beloved cliche of our space - BITCOIN SOLVES THIS. Control the money, control your future.
Trading Exercise - Can You Guess Up Or Down?
This is an interesting exercise that I came up with for traders that I have taken to attempting on my own. I have roughly a 65% hit rate in the past month, which I find to be excellent.
In sports betting, you can beat the spread 60% of the time and be a legend. Most barely crack 51%. That’s binary - right or wrong. Trading is exponentially harder, so starting with “up or down” is a good exercise to show just how hard it is, before considering risk management.
Can you be right 50% of the time? If so, the next exercise is deciding where you would theoretically place your stop loss and take profit orders. When you consider risk management, you not only have to be right about direction, but have to avoid being stopped out before it goes your way and also have to be willing to exit in profit before a directional change against you.
The exercise is difficult, and will display just how important risk management really is - it's everything!
Interview With Mr. Backwards
I had a great time speaking with Mr. Backwards and was flattered that he chose to interview me. This one goes pretty deep, discussing how I went from an irresponsible bedroom DJ to a successful stadium DJ and then to a trader. Enjoy!
My Preferred Platforms And Tools
This is where I invest, commission-free. They now let you earn 3% interest on your Bitcoin held in Voyager, so you can compound while trading. Not only that, you’ll get $25 in free BTC when you download & fund.
URL: http://go.onelink.me/4gTR/ba4cd7d3
Rewards Code: WOLF25
I use RoundlyX to buy small amounts of Bitcoin every single day. They automatically round up my credit card purchases (with 10x multiplier) and invest them in crypto. Absolutely brilliant. Passively invest money you don’t need without a thought. Further, they have integrated with Voyager (see above) to offer commission-free purchases.
I use this platform more than any other and have the top tier account (yes, I paid). This is where I do all of my charting and TA and set my alarms to let me know when to check a chart. If you are not using TV, you are not a trader!
https://www.tradingview.com/gopro/?share_your_love=ScottMelker
Uncensorable .crypto domains (like scottmelker.crypto) that cannot be removed by hostile actors.
Gives us the ability to simply send Bitcoin & alts directly to a .crypto extension. Eliminates the confusion of long addresses.
https://unstoppabledomains.com/r/thewolfofallstreets
ESSENTIAL platform for doing taxes. I execute thousands of trades a year and they calculate what I owe accurately within a few minutes. It’s amazing and cheap ($29.95). They were kind enough to offer 10% off to my followers.
Follow me on Twitter at @scottmelker. This is where I am constantly updating my trades and sharing ideas.
The views and opinions expressed here are solely my own and should in no way be interpreted as financial advice. Every investment and trading move involves risk. You should conduct your own research when making a decision. I am not a financial advisor.