


The Wolf Den #134 - Are Institutions Going To Sell?


Bitcoin Thoughts And Analysis
If you don't know what I am about to say, then you definitely have not been reading the recent newsletters or following me at all.
WE HAVE BULLISH DIVERGENCE WITH RSI ON THE 4-HOUR CHART!
As I did at the end of November, I once again was able to predict that we would likely see an oversold bullish divergence with RSI on the 4-hour chart, my favorite trading setup. I drew the idea above in blue, the same as a few weeks ago.
I went long this morning at around $17,700, a bit early because the divergence was not yet confirmed. We merely had the lower low in price and the higher potential low on RSI. I have been trading these for a very long time, and was comfortable taking the position there, knowing that confirmation may not come and I will be forced to take a loss.
But I have seen them enough times, and was watching it develop... so it falls within my system to take a shot.
This div has been confirmed, with the definitive elbow up on RSI. Further, it managed to avoid a hidden bear div at the close, which is always nice. This divergence could still continue to build with even lower lows on price, but I am feeling decent about my position and have no intention of exiting for the moment. This could be a bottom for a while if I am correct (usually I am not!) so I want to give this position some room to breathe if this is a bottom before another shot at the highs. A leveraged long from $17,700 to $20,000 or beyond would be quite a trade!
More importantly, in a situation like this it is prudent to look to lower time frames to see if divergences have already confirmed. They tend to build from lower to higher time frames, adding additional confidence with each confirmation. As you can see above, the hourly was building and confirming divergences long before the 4 hour finally managed to look promising. When I saw this, I had no problem entering without 4-hour confirmation.
It is much easier to hunt for divergences on the line chart, so here it is for clarity on the 4-hour. I am still watching the RSI resistance and have an alarm set. A break would be further confirmation for me that we are likely to continue up.
Altcoin Charts
I realized after sending yesterday's newsletter that I had not included the name of the setup, which was POLS/USDT - Polkastarter. Unfortunately, I had to chart the pair on a separate crappy platform from TradingView, so it was also impossible to read. Nothing has really changed, so you can still take a look at it now that you know what it is.
EGLD/BTC
This is an update to a trade that I have shared a number of times. As you can price, after a few days, price is finally attempting to push through resistance. If the daily closes above 792, I will place orders around that area to add to my position if it drops back to retest it as support. If it continues without a retest, I will continue on with my life!
EGLD/USDT
I am now trading EGLD on Binance.US, where they have the USDT pair and not the BTC pair. The USDT chart looks great as well, with a beautiful rounding bottom pattern that has been there since trading began. A rounding bottom is not the same as a cup and handle, which can only be valid as continuation. The rounding bottom does not have a handle - it just continues up! You can see the relevant levels marked. It's floating between 2 areas of interest now, so if you are not in it's safest to buy a bounce from support below or a break and retest of resistance above. Here is more information on the Rounding Bottom.

Why Exposure To Bitcoin and Ethereum Reduces Overall Portfolio Risk
This is a gem from all the way back at newsletter #2!
This is a spectacular statement from Venture Coinist and Ari Paul on why every portfolio manager and institution should have exposure, even if only minimal, to Bitcoin and cryptocurrency. The basic idea is that risk managers generally look to diversify their portfolios and seek the rare opportunity to expose themselves to assets with more idiosyncratic risk than systematic risk. Systematic risk describes an asset that largely moves with the global economy or market as a whole. Bitcoin and crypto are largely uncorrelated to other markets. So, investing in Bitcoin with a small portion of the portfolio offers idiosyncratic risk, which Ari Paul describes in the video as the “Holy Grail of investing.” Now that Ethereum is gaining institutional traction, I also believe it offers a similar level of idiosyncratic risk to Bitcoin. Watch the video!
Trading With MACD 101
Written by Christopher Inks
The MACD indicator, which stands for Moving Average Convergence Divergence, is a trend-following momentum indicator that belongs to a specific family of indicators known as oscillators. This means that it can be helpful in a trending market but not much in a ranging market since the indicator is designed to fluctuate between low and high bounds. As a matter of fact, a trader is more often going to lose money attempting to use the MACD in a ranging market than not.
It can be used to determine overbought and oversold conditions, determine the market’s momentum, and even to identify divergences that lead to reversals. It is also important for traders to understand that the MACD is, for the most part, a lagging indicator meaning that it tends to tell you what has happened which is useful in confirming a trend. But, as with most things, there is an exception and that is when using it to identify possible trend reversals. In this latter case, it can be viewed as a leading indicator.
How is the MACD Calculated
The Moving Average Convergence Divergence indicator is made up of the MACD line, the signal line, the zero line, and a histogram. By default, the MACD line is calculated by subtracting the 26 period EMA from the 12 period EMA. The further these two EMAs pull apart the higher the MACD line rises while the closer they come together the lower the MACD lines declines. The signal line is the MACD’s 9 period EMA and is plotted on top of the MACD to be used as a buy or sell trigger. When the MACD line is above the signal line the market is trending upward and when the MACD line is below the signal line the market is trending downward.

The zero line is the indicator’s equilibrium. This is the area of the indicator where the histogram fluctuates between positive (green) and negative (red). When the MACD is above the signal line it indicates that the market is more bullish. Conversely, when the MACD is below the signal line it indicates that the market is more bearish.
MACD’s histogram provides a visual for the distance between the MACD line and the signal line. As the MACD line pulls away from the signal line, the histogram expands. It then contracts when the MACD line pulls closer to the signal line. This can help traders identify when bullish or bearish momentum is increasing or decreasing. The histogram will be above the zero line when the MACD is above the signal line and below the zero line when the MACD is below the signal line.
How to Profit with the MACD
So how do we use the MACD to make money? As already mentioned, one way is to determine whether the market is more bullish or bearish by noting if the MACD is above or below the zero line. Another way is to determine whether the market is trending bullishly or bearishly. If the MACD is rising, then the market is understood to be trending bullishly and if declining then it is trending bearishly. But because this is lagging information, traders should not expect to use the MACD indicator in this way to buy the absolute lowest price or to sell the absolute highest price.
A third way to use the MACD indicator is to buy the asset or security when the MACD line crosses above the signal line (positive crossover) and to sell it when the MACD line crosses below the signal line (negative crossover). Again, traders will not be buying the absolute low or selling the absolute high, but the crossover can act as confirmation for an entry into, or exit out of, the market. The stronger the trend, the better this technique works. The positive crossover is most effective when it occurs below the zero line. The negative crossover is most effective when it occurs above the zero line. But the weaker the trend the more likely the indicator is to give false signals.
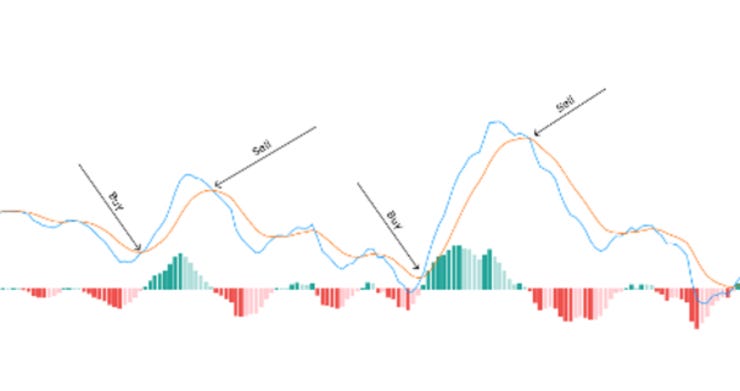
Divergences are a fourth way to use the indicator. Used in this way, the MACD becomes a leading indicator rather than lagging one. What traders want to look for are divergences between the indicator and price action. If price is making a higher high while the MACD is making a lower high, then that divergence may be signaling that the price is nearing a point where price will be reversing lower. And if price is making a lower low while the MACD is making a higher low, then that divergence may be signaling that price is nearing a point where it will be reversing higher.

Finally, traders can use the MACD’s histogram to signal when to enter or exit a trade. As with the divergence technique just described, if price is making a higher high but the histogram peaks are making lower highs, then traders should be prepared for price to reverse lower. And if the histogram troughs are making higher lows while price is making lower lows, then traders should be prepared for price to reverse higher. This divergence is often seen sooner than the MACD line and price action divergence thereby giving traders more of a heads up.

As with all indicators, the MACD should not be used as a trader’s sole reason for entering or exiting a trade. Higher confidence is found in confluence. This is when a trader combines multiple trading techniques or analysis thereby increasing the likelihood that the signal is legitimate. If the MACD provides a signal, traders are best served by looking at other indicators or candlestick patterns, for example, to see if they are also giving the same signal. The more confluence a trader has with a signal, the more likely they are to complete a winning trade.
For more information like this and to interact with Chris on a daily basis, join his Discord and take his course! - https://howtotradetowin.com/
Overton Window 101
In 2020, as previously obscure and extreme policy actions have gained mainstream support, it appears the Overton Window has shifted. But what is the "Overton Window" and how does it work? Here's Overton Window 101!
First, a few definitions. The "Overton Window" is the range of policies that are politically acceptable to the mainstream in a given society at a given moment. If you place all policies on a spectrum of extremes, the Overton Window covers a subset of that spectrum.
The term is named after Joseph Overton, the late executive at the Mackinac Center for Public Policy, a free-market, small-government think tank. As part of fundraising for the organization, Overton created a brochure for potential donors explaining the role of a think tank.
In the brochure, Overton argued that politicians only propose policies that fall within the window of what is politically acceptable to the mainstream at that moment in time. The role of a think tank, therefore, is to propose ideas outside the window in hopes of shifting it.
So it was that the Overton Window was born. The viability of a proposed policy is highly dependent on whether or not it falls within the current range. Importantly, the Overton Window is not fixed, but dynamic. Let's look at a simple illustration to show how this works.
The window is dynamic. It can widen symmetrically or asymmetrically, moving beyond the popular to cover the sensible or acceptable. Ideas can move on the spectrum (i.e. become less extreme in the public eye) to fall within the window. It sways with the political winds.
The concept of the Overton Window is foundational to the strategies that politicians and policymakers on both sides of the aisle have developed and executed in recent years. Let's look at some examples of how it comes into play and impacts the economy, markets, and our lives.
Progressive Economic Policy? MMT and other progressive policies (e.g. Medicare for All, 70%+ marginal tax rates) are classic examples of a long-term shift in the Overton Window. Once viewed as wildly radical ("Unthinkable"), they appear to be entering the general lexicon.
How did the Overton Window shift in this way? It was gradual - the result of long-term efforts from policymakers and economists set against a backdrop of rising economic inequality. You can disagree with the policies, but it is undeniable that the Overton Window has shifted.
While this (and most) examples of shifts in the Overton Window happen gradually, they can also happen abruptly. Example: Helicopter Money. Milton Friedman's parable of a helicopter dropping money to the people felt like an extreme thought experiment, not a future reality.
But in 2020, a deflationary "Black Swan" event - COVID-19 and the ensuing lockdowns - precipitated an abrupt shift in the Overton Window. The notion of direct checks from the government to the people became mainstream. Even Republican "budget hawks" got behind the idea.
Historically, economic shocks have a tendency to rapidly shift the Overton Window. The roots of current mainstream public sentiment on bailouts and aggressive Central Banking policy can be found in times of economic shock. There will be more examples in the years ahead.
So as we recover from this shock, keep an eye on the Overton Window and its shifts. A few policy areas to watch for as they teeter on the edge of the Overton Window: Central Bank Digital Currencies; (2) Big Tech Breakups; (3) Dissolution of the 2-Party System
This was an (admittedly) America-centric discussion, but the Overton Window applies globally. I would love to hear from my international followers with examples of shifts from other countries! So that was Overton Window 101. I hope it was useful.

$100 BTC Giveaway - Every Day Until Christmas!
In the spirit of the holidays, I have decided to give away $100 in Bitcoin every single day from now until Xmas. All you have to do to enter is subscribe to my YouTube Channel and comment under the video (embedded above) with your Twitter handle. Good luck, I hope you guys win!
MassMutual Purchases 100 Million In Bitcoin
MassMutual has a massive investment portfolio - $225 billion to be exact. Their Bitcoin bet is large, but is only .04% of their investment portfolio. In an interview, MassMutual said their strategy is to "take advantage of new opportunities" while continuing to diversify their portfolio and receive “measured yet meaningful exposure to a growing economic aspect of our increasingly digital world.” This is probably the course of action that many companies will take as they begin to explore digital assets, just dipping their toes in to start. The big money is coming.
Raoul Pal Goes On A Crypto Twitter Rant

The CEO and Founder of Real Vision, Raoul Pal, made some bold predictions on Twitter about how big the crypto market could become once mixed in with the global financial markets. He said that crypto will play a role in derivatives, FX, settlements,and more which, added together, would be QUADRILIONS of dollars. A couple of his quotes below from the rant are ones that resonated with me. Beyond his far-out predictions, he did say that he believes Ethereum will have a bigger market cap than Bitcoin within ten years. This seemed to catch the most media attention of all of his claims.
“There will be many enormous winners, many failures, many scams, many false dawns but in the end, trillions and trillions of value will accrue across digital assets, tokens, protocols, and crypto that tie all of this together.”
“The future is a super network of blockchains with the most pristine being bitcoin and the risk curve moves out from there.”
Terra Virtua (TVK) Launches Today


I invested in the private sale of Terra Virtua a few months ago and it is finally launching today. I am NOT telling you to FOMO into the public sale by any means, I just believe that this is news worth sharing for those that have been following the hype around this project. You can read more about Terra Virtua here:
The Home of Digital Collectibles.

Phemex Is Giving Away A Tesla!
Happy holidays! This Christmas Phemex has a very special surprise for you. Start trading Bitcoin on Phemex and enter for a chance to win a Tesla Model 3!
PHEMEX IS GIVING AWAY A TESLA. They are also offering up to a $600 bonus for anyone who deposits for the next few weeks using the link below. This is dependent on how much you choose to deposit. Sign up here!
https://phemex.com/a/ScottMelker
Tokenized Stocks From Bittrex Global
Bittrex Global is offering all of the Wolf Den's readers the ability to now buy tokenized stocks from Tesla, Apple, Amazon and more. Please visit https://global.bittrex.com/discover/tokenized-stocks to get fractional shares of your favorite stocks now from almost anywhere in the world.
My Recommended Platforms And Tools
This is where I trade with leverage and can also trade spot with no fees.\
This is where I spend my days teaching and learning! Our Discord group is a one stop shop for everything you need to learn to trade and control your emotions. Feel free to DM me on Twitter or respond to this email for questions.
This is where I invest, commission-free. They now let you earn interest on your Bitcoin held in Voyager, so you can compound while trading. Not only that, you’ll get $25 in free BTC when you download & fund.
Rewards Code: Scott25
I use RoundlyX to buy small amounts of Bitcoin every single day. They automatically round up my credit card purchases (with 10x multiplier) and invest them in crypto. Absolutely brilliant. Passively invest money you don’t need without a thought. Further, they have integrated with Voyager (see above) to offer commission-free purchases.
Rewards Code: WOLF
Binance is finally available in Florida!
Concierge Phone Service for Americans that protects your from SIM Swaps and other phone related hacks. I cannot stress enough how amazing this service is.
Follow me on Twitter at @scottmelker. This is where I am constantly updating my trades and sharing ideas.
On-chain and fundamental analysis, research, predictions and indicators, all in one place. Highly recommend.
The views and opinions expressed here are solely my own and should in no way be interpreted as financial advice. Every investment and trading move involves risk. You should conduct your own research when making a decision. I am not a financial advisor.