


The Wolf Den #1116 - The Wall of Worry
Climbing...

Welcome to The Wolf Den! This is where I share the news, my ideas about the market, technical analysis, education and my random musings. The newsletter is released every weekday and is completely FREE. Subscribe!
Important Announcement From Arch Public!
Next week Arch Public will be releasing an update to our Bitcoin Algorithm. Specifically, an Arbitrage strategy that is extraordinarily powerful. How powerful you might ask:
234% annualized returns.
11% annual cash flow.
You’re reading that correctly. Our Bitcoin Algorithm Arbitrage strategy will generate cash flow, while also producing exceptional annual returns that are 4.5X buy and hold Bitcoin returns.
Most of you reading this believe in Bitcoin, and so do we. Employing a strategy that generates cash flow, protects downside risk, and aggressively buys dips (completely hands free!) is about to be available to you.
Try Arch Public now! You can even demo the platform for free to learn more.
In This Issue:
The Wall of Worry
Bitcoin Thoughts And Analysis
Altcoin Charts
Legacy Markets
Tether Is Relocating To El Salvador
The Crypto Fear & Greed is Broken
Saylor Is Inching Closer To 500,000 BTC
Coinbase Wins Again
Bitcoin Is Crashing! $80K Next? What’s REALLY Behind the Drop? | Macro Monday
The Wall of Worry
“Bull markets climb a wall of worry; bear markets slide down a river of hope.”
This quote is legendary—a timeless piece of Wall Street wisdom with origins shrouded in mystery, yet it continues to resonate. At its core, the quote captures the essence of market psychology: bull markets are met with relentless skepticism, while bear markets are sustained by lingering optimism.
In a bull market, there’s always a chorus of critics, doubters, and skeptics highlighting every possible risk or catastrophic scenario that could derail upward momentum. This skepticism is fueled by lessons from past cycles, a tendency to be contrarian, and a natural caution against overconfidence in rising markets. Thus, the metaphor of “climbing a wall of worry” emerges. Assets ascend despite a constant barrage of doubt and negativity. The rally often ends when the last remaining skeptics capitulate, surrendering to FOMO, and the final wave of capital floods in.
The “wall of worry” is built brick by brick, with each piece of negative news forcing optimistic investors to crane their necks upward and push past yet another challenge. On the flip side, bear markets are defined by the slow erosion of hope. Investors cling to optimism, sliding down a “river of hope” even as the market declines. They wait for a turnaround that never comes, until fear ultimately overwhelms hope and capitulation sets in.
This enduring metaphor brilliantly encapsulates the emotional landscape of market cycles, underscoring the interplay between fear, optimism, and eventual reality.
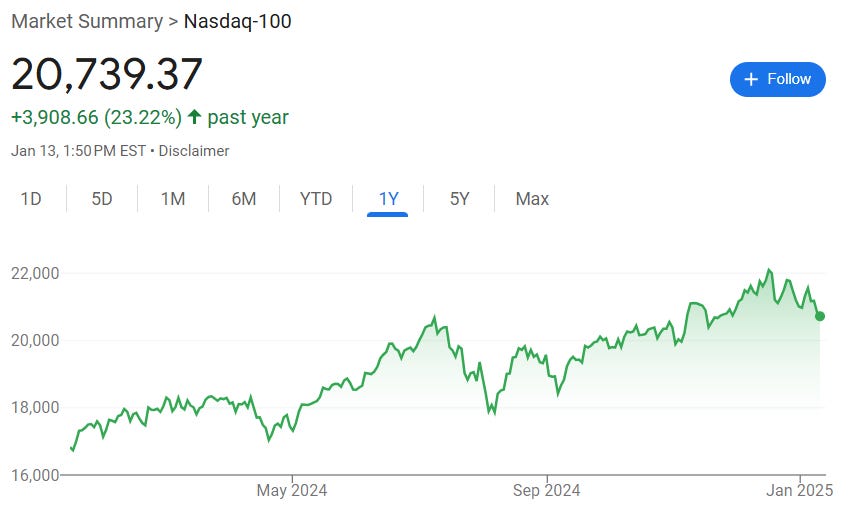
To be fair, when I look at legacy markets, it’s hard to even argue that we’re in a period that justifies a true “wall of worry.” The skepticism and caution that typically define such times seem absent, replaced by a complacency that doesn’t align with the metaphor’s traditional setup.

Here’s the Nasdaq-100—it still looks solid to me. The chart doesn’t exactly scream “wall of worry,” does it?
For legacy markets, the only real concerns for investors right now seem to be:
Temporary uncertainty around U.S. politics.
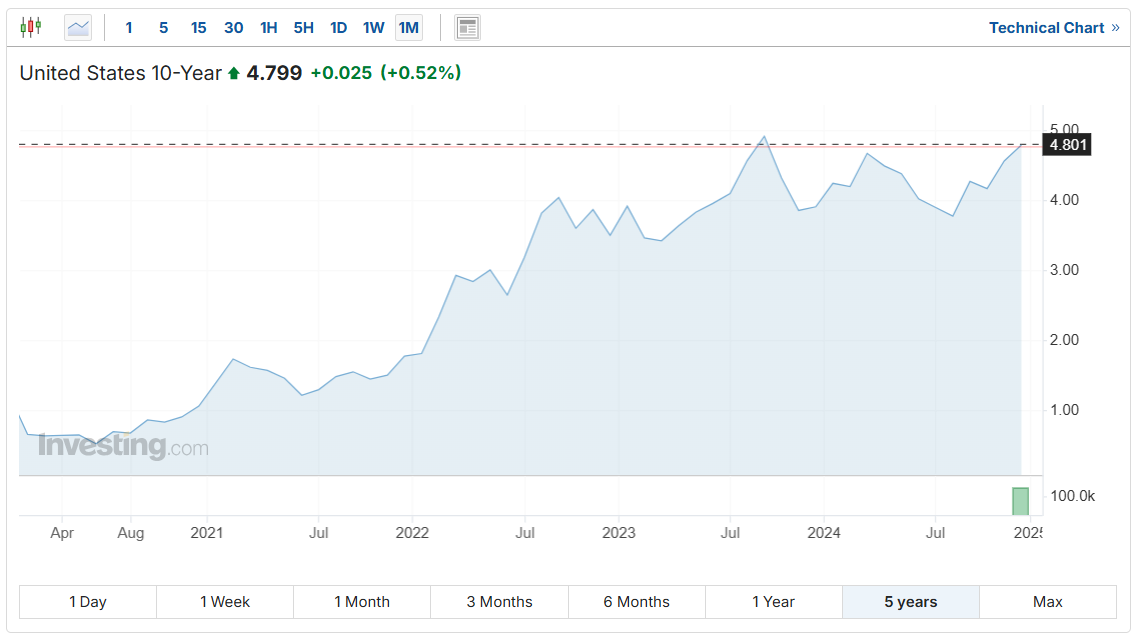
The 10-Year Treasury nearing 5%.
The DXY marching toward 110.
The Fed signaling fewer rate cuts.
Let’s briefly break these down:
Does anyone remember what happened to markets the day after Trump was elected? All of our net worths got a nice boost—especially for crypto holders. History doesn’t repeat, but it rhymes.

The current uncertainty isn’t so much about Trump’s policies or his bold style—it’s more about the broader political transitions on the horizon. As an investor in legacy markets, I see this as a net positive. Once the dust settles, so will the anxiety, creating a clearer path forward.
This is slightly more concerning but far from catastrophic. Below, you’ll see a 5-year chart for context. Notice the bottom left corner—Treasury yields hit their all-time historical low almost exactly five years ago. Fast forward to today, and the 10-year Treasury yield has climbed to a fresh 14-month high, its highest level since November 1, 2023. While this shift is significant, it reflects a normalization of rates rather than a red flag for markets.
For a broader historical picture:

Before diving into my analysis, let me share the DXY chart first. Once we have that visual, I’ll combine my thoughts on both yields and the DXY for a more cohesive perspective.

When the DXY (a measure of the dollar's strength against other major currencies) rises alongside the 10-year Treasury yield, it creates a challenging environment for markets, particularly growth stocks. A stronger dollar makes U.S. exports more expensive for foreign buyers and reduces the value of foreign earnings for American companies, squeezing corporate profits. At the same time, rising Treasury yields increase borrowing costs for businesses and consumers, while making bonds a more attractive option compared to riskier assets like stocks. Together, these factors tighten financial conditions, suppress risk appetite, and exert downward pressure on markets.
In an ideal scenario for risk markets, Trump could come into office and crank up the money printer to “fix things,” reversing some of these trends. While this would likely reintroduce inflation concerns and the potential for rate cuts, it also creates the kind of uncertainty Bitcoin thrives on. However, Trump is a strong-dollar advocate, so he may not be concerned if the dollar continues to climb—and investors will likely catch on to that dynamic quickly.
I shared this image on my livestream yesterday. It’s obviously a bit of hyperbole since legacy markets are holding up relatively well, but for crypto—the higher beta market—it’s definitely stirring up more chaos.

As for the Fed signaling fewer rate cuts, I don’t see it as a make-or-break factor for the broader market. The bigger question is how much Trump cranks up the money printer and how his policies will influence the country’s growth. Right now, the “wall of worry” for legacy markets feels more like a chest-high fence—something investors with a bit of common sense and agility can easily get over.
For crypto, the story is largely the same, but with a few additional layers of complexity:
Crypto is inherently more sensitive to the uncertainties that shape this general “wall of worry.” As a smaller and more volatile market, it feels the impacts of losses more acutely and benefits from gains more dramatically. Its relative youth adds another layer of volatility as the industry continues to establish its place within the broader financial ecosystem. Positioned further out on the risk curve, crypto’s sensitivity increases exponentially beyond Bitcoin—extending to majors, mid-caps, and smaller altcoins. For example, a minor jobs report detail that nudges legacy markets down by 0.5% can cascade into far deeper pain as capital pulls out across the crypto space.
Right now, speculative sectors like AI and meme coins are taking a gut punch, while Bitcoin has corrected to...checks notes...$90,000. Bitcoin investors are doing just fine—almost as fine as those in legacy markets. Speculative altcoin holders, however, are definitely feeling the pullback, but that’s the nature of the risk-reward tradeoff they’ve signed up for.
Fundamentally, nothing about crypto concerns me at the moment. The market is trimming the fat further down the risk curve, where hype has outpaced substance, while Bitcoin steadies itself and prepares for its next climb higher.
Here’s the critical point:
It’s this ‘wall’—or more accurately, this fence—that will propel us higher. Investors who skipped their burpees and ab crunches might struggle to get over it, but the rest will. Sure, the wall gets steeper further down the risk curve, but I don’t see any barrier right now that isn’t manageable given the state of the markets.
Yesterday on the live show, I bought BTC and SOL, and I’ll continue looking for entries if the market provides opportunities.
Consider this letter your boost over the fence—the escalator higher is waiting on the other side.
In other news, there’s this:

At this point, I’d be genuinely shocked if we didn’t see an executive order on day one. The real question is how far this administration is willing to go to support the crypto space. What’s still vastly overlooked is just how positive this administration could be for the industry.

Bitcoin Thoughts And Analysis

Bitcoin's daily chart provides a fascinating look at price action, highlighted by yesterday's epic candle. The candle is a classic dragonfly doji, characterized by a long lower wick and a green close near the high of the day, signifying a strong rejection of lower prices and a battle won by the bulls. This candle formed after testing the key support zone around $88,800-$90,600 and indicates heavy buyer interest in this area.
We need to see follow through and a green candle today.
The price action today, however solid, is showing hesitation, with Bitcoin facing rejection at the 50-day moving average (now at $97,300). This level has been a key dynamic resistance since it was lost earlier in January, and regaining it would be a critical step for bullish momentum to build.
The RSI has started to curl upward but remains neutral, leaving room for further movement in either direction. Yesterday's volume surge was impressive, showing that market participants are actively defending the support zone, but today's volume so far is lighter, which could indicate caution or consolidation before the next move.
From an alternative perspective, the potential head-and-shoulders pattern still looms, with the neckline around $91,300. For now, the strong support and bullish candle suggest a temporary reprieve, but Bitcoin will need a clean break above the 50 MA and $99,860 resistance to invalidate bearish structures and open the path toward $106,099. Keeping an eye on RSI divergences or volume spikes at these levels could provide clues for the next move.
For now, my fake out below the neckline theory is playing out. This looks like a likely bottom.

The Bitcoin daily chart with Bollinger Bands reveals important insights about current market behavior and potential future moves. Yesterday's dragonfly doji, combined with the lower Bollinger Band acting as support, suggests a strong rejection of lower prices. The long lower wick indicates heavy buying interest, aligning with the zone near $88,800–$90,600, which has been a key demand area.
Bitcoin's price is currently pushing back toward the middle Bollinger Band, which aligns closely with the 20-day moving average at approximately $95,582. This level is often considered a pivot point between bullish and bearish trends. A clean close above this middle band could signal strength and potentially open the door for a retest of the upper band, currently near $100,160.
On the other hand, rejection at the middle band would imply consolidation or further downside, with the lower band near $91,003 likely to act as support again. The bands themselves have started to widen slightly, which could indicate increased volatility in the coming days. However, the volume remains relatively light compared to prior strong directional moves, suggesting indecision in the market.
The Bollinger Bands also highlight that Bitcoin is not yet in an overbought or oversold condition on the daily timeframe, leaving room for further price exploration. A breakout from the bands, either up or down, would be a strong signal to watch for in terms of directionality. For now, the focus remains on reclaiming the middle band and watching how price interacts with key moving averages and support/resistance levels.
Altcoin Charts
Almost every altcoin had a nice bounce yesterday, with candles looking similar to that on Bitcoin - but not as aggressive. It is important to note that altcoins look like they are reversing, but still less than Bitcoin, which is likely to still dominate the market for now.

The CPOOL daily chart shows impressive resilience, delivering the most significant bounce among the altcoins observed yesterday. Price action surged from a key demand and support zone between $0.24 and $0.26, a range that has consistently proven to attract buyers. The massive green candle that formed is a bullish engulfing candle, accompanied by a long lower wick that highlights strong buying pressure and rejection of lower prices.
The move propelled CPOOL back above the $0.30 psychological level, with the candle closing near $0.33—a considerable recovery from the intraday lows. The increased volume during the bounce underscores the market's conviction in defending this support zone, which could act as a foundation for further upside.
Currently, the 50-day moving average, situated at approximately $0.40, looms as a key resistance level. If CPOOL continues its upward trajectory, retesting this level would be a pivotal moment to gauge the strength of the recovery. Meanwhile, the 200-day moving average at $0.21 remains a robust long-term support.
Although yesterday's bounce is a positive sign, the market must sustain this momentum to avoid falling back into the support zone. Traders should monitor for follow-through buying and increased volume to confirm the bullish sentiment.
*I own this token, with an earlier entry around 17 cents.

I bought Solana yesterday morning, live during Macro Monday. I said this about it yesterday on X.

Now that the day is over, here is more thorough analysis.
The Solana (SOL) daily chart demonstrates a significant bounce after testing the key horizontal support level around $175.26. Yesterday's candle showed a long lower wick, indicative of substantial buying interest at lower levels, but the close was still relatively weak, below the $190 region. Today, Solana is attempting to sustain its recovery, but upside momentum remains limited for now.
The 50-day moving average, currently sitting at $210.50, has been acting as dynamic resistance since late December, and reclaiming this level will be critical for any bullish continuation. Meanwhile, the 200-day moving average at $173.14 provides a broader structural support base, closely aligning with the horizontal support zone.
Volume during the recent sell-off was elevated, signaling significant market participation in this range. While yesterday's bounce indicates buyers stepping in, further confirmation in the form of a higher close and follow-through is required to validate a reversal attempt. For now, the $175-$190 zone remains a critical battleground, and failure to hold above $175 could open the door to further downside.
RSI is hovering near oversold territory, suggesting that the asset may be nearing a short-term bottom. However, a stronger bullish catalyst or broader market strength will be necessary for Solana to regain its upward trajectory. Watch for volume and price action around the 50 MA to gauge the strength of any recovery.
Legacy Markets

Global stocks rebounded on Tuesday, buoyed by reports that President-elect Donald Trump’s economic team may pursue a gradual approach to trade tariffs, potentially easing inflationary pressures and growth risks. US equity futures rose, with Nasdaq 100 and S&P 500 contracts gaining 0.4% and 0.3%, respectively, while European equities climbed 0.6%, led by the auto sector. The dollar index fell after five consecutive days of gains, and global bond markets steadied following recent spikes in borrowing costs.
The report of gradual tariff hikes, ranging from 2% to 5% monthly, sparked cautious optimism but was met with some skepticism due to Trump’s past dismissal of moderation in trade policies. The market’s focus now shifts to key US inflation data, including the CPI report on Wednesday, as well as December retail sales. These indicators are crucial in gauging whether disinflationary trends persisted through year-end, particularly following robust holiday spending.
Investors are also eyeing the corporate earnings season, with major banks like JPMorgan, Citigroup, and Goldman Sachs set to report this week. Analysts expect S&P 500 fourth-quarter earnings to grow 7.3% year-over-year. Despite the rally, sentiment remains fragile due to recent losses on the S&P 500 and concerns over sweeping AI chip restrictions that could impact Nvidia and its peers. Markets are looking to earnings season for signs of stability amidst inflationary and policy uncertainties.
Key events this week:
US PPI, Tuesday
Fed’s John Williams and Jeffrey Schmid speak, Tuesday
Eurozone industrial production, Wednesday
Citigroup, JPMorgan, Goldman Sachs, BNY, Wells Fargo and BlackRock earnings, Wednesday
US CPI, Empire manufacturing, Wednesday
Fed’s John Williams, Tom Barkin, Austan Goolsbee and Neel Kashkari speak, Wednesday
TSMC earnings, Thursday
ECB releases account of December policy meeting, Thursday
Bank of America, Morgan Stanley earnings, Thursday
US initial jobless claims, retail sales, import prices, Thursday
China GDP, property prices, retail sales, industrial production, Friday
Eurozone CPI, Friday
US housing starts, industrial production, Friday
Some of the main moves in markets:
Stocks
S&P 500 futures rose 0.3% as of 7:09 a.m. New York time
Nasdaq 100 futures rose 0.4%
Futures on the Dow Jones Industrial Average rose 0.2%
The Stoxx Europe 600 rose 0.4%
The MSCI World Index was little changed
Currencies
The Bloomberg Dollar Spot Index fell 0.1%
The euro was little changed at $1.0249
The British pound fell 0.3% to $1.2170
The Japanese yen fell 0.4% to 158.06 per dollar
Cryptocurrencies
Bitcoin rose 2.2% to $96,289.01
Ether rose 2.9% to $3,205.2
Bonds
The yield on 10-year Treasuries advanced one basis point to 4.79%
Germany’s 10-year yield advanced two basis points to 2.63%
Britain’s 10-year yield was little changed at 4.89%
Commodities
West Texas Intermediate crude fell 0.4% to $78.52 a barrel
Spot gold rose 0.2% to $2,668.37 an ounce

Tether Is Relocating To El Salvador

Just last week, Bitfinex Derivatives announced its relocation to El Salvador after securing a second Digital Asset Service Provider (DASP) license. Now, Tether—the largest stablecoin provider in the industry—has followed suit, citing El Salvador’s “forward-thinking policies, favorable regulatory environment, and a growing Bitcoin-savvy community.”
For both the market and El Salvador, I hope these moves successfully position the country as the definitive crypto hub of Latin America while benefiting Tether, which remains a cornerstone of the crypto ecosystem. Fun fact: Tether’s annual net income is equivalent to 35% of El Salvador’s GDP—a staggering statistic.
From Tether’s official PR release:
“Tether and its subsidiaries are about to complete all formalities to relocate to El Salvador, following the successful acquisition of a Digital Asset Service Provider (DASP) license and as a stablecoin issuer, marking a step in Tether’s journey to foster global Bitcoin adoption.”
From Paolo Ardoino, CEO of Tether:
“This decision is a natural progression for Tether as it allows us to build a new home, foster collaboration, and strengthen our focus on emerging markets. El Salvador represents a beacon of innovation in the digital assets space. By rooting ourselves here, we are not only aligning with a country that shares our vision in terms of financial freedom, innovation, and resilience but is also reinforcing our commitment to empowering people worldwide through decentralized technologies.”
The Crypto Fear & Greed is Broken

The Crypto Fear & Greed Index isn’t reflecting the current reality. Nothing about the state of crypto right now justifies being in the “Greed” territory. Crypto is down significantly more than stocks, yet the U.S. market Fear & Greed Index (from CNN) has us in “Extreme Fear,” which feels far more accurate. If you’re still referencing the Crypto Fear & Greed Index as a meaningful metric, it’s time to toss it—it’s completely useless.

Saylor Is Inching Closer To 500,000 BTC

Following yesterday’s announcement of another Bitcoin purchase, Saylor’s acquisition of 2,530 BTC brings his total holdings to an astonishing 450,000 BTC. This puts him 45% of the way to his goal of 1 million BTC and just 50,000 BTC short of crossing the halfway mark. Even more impressive, this marks the 10th consecutive week that Saylor has bought Bitcoin—WOW.
Coinbase Wins Again

The U.S. Court of Appeals for the Third Circuit has called out the SEC for its lack of reasoning in denying Coinbase’s request for crypto-specific rules, describing the agency’s decision as “arbitrary and capricious.” While the court partially granted Coinbase’s petition, it stopped short of compelling the SEC to establish new rules, instead directing the agency to provide a more detailed explanation.
From the court’s ruling:
“Because we believe the SEC’s order was conclusory and insufficiently reasoned, and thus arbitrary and capricious, we grant Coinbase’s petition in part and remand to the SEC for a more complete explanation. But we decline at this stage to order the agency to institute rulemaking proceedings.”

Bitcoin Is Crashing! $80K Next? What’s REALLY Behind the Drop? | Macro Monday
Join Dave Weisberger, Mike McGlone, and James Lavish as we break down what's happening in macro and crypto!
My Recommended Platforms And Tools
Aptos - The blockchain network with everything you need to build your big idea. Unrivaled Speed, Unprecedented Trust, and an Unstoppable Community on Aptos.
Phemex - Join me on Phemex and unlock up to 30,000 USDT in exclusive rewards! Phemex is the most efficient crypto trading and investment platform.
Arch Public - It’s a hedge fund in your pocket. Built for retail traders, designed to outperform Wall Street. Try emotionless algorithmic trading at Arch Public today.
Trading Alpha - Trade With Confidence! My new go-to indicator site and trading community. Use code '10OFF' for a 10% discount.
X - I spend most of my time on X, contributing to CryptoTownHall every weekday morning, sharing random charts, and responding to as many of you as I can.
YouTube - Home of the Wolf Of All Streets Podcast and daily livestreams. Market updates, charts, and analysis! Sit down, strap in, and get ready—we’re going deep
The views and opinions expressed here are solely my own and should in no way be interpreted as financial advice. Every investment and trading move involves risk. You should conduct your own research when making a decision. I am not a financial advisor. Nothing contained in this e-mail constitutes or shall be construed as an offering of financial instruments or as investment advice or recommendations of an investment strategy or whether or not to "Buy," "Sell," or "Hold" an investment.