


The Wolf Den #1103 - Is Bitcoin Overheated?
No.

Welcome to The Wolf Den! This is where I share the news, my ideas about the market, technical analysis, education and my random musings. The newsletter is released every weekday and is completely FREE. Subscribe!
Today’s Newsletter Is Made Possible By Phemex!

Join me on Phemex and unlock up to 30,000 USDT in exclusive rewards! Use my link HERE.
Phemex is the most efficient crypto trading and investment platform. Phemex offers over 400 trading pairs, minimal fees, peer to peer trading, derivatives, up to 100x leverage.
Make sure to check if Phemex is available in your jurisdiction.
In This Issue:
Is Bitcoin Overheated?
Bitcoin Thoughts And Analysis
Altcoin Charts
Legacy Markets
German Finance Minister Pleads For Bitcoin
When Will Saylor Reach 1 Million BTC?
Ripple’s Stablecoin Launches Today!
Ether.Fi Explores Token Buybacks
Bitcoin Hits $106K: Record-Breaking Rally Ahead Of Crucial Fed Announcement | Macro Monday
Is Bitcoin Overheated?
In yesterday’s newsletter, I covered VanEck’s Top 10 Crypto Predictions for 2025 and highlighted the firm’s emphasis on MVRV as a key metric for determining when the market is “overheated.”
Here’s what VanEck said:
“Overvalued Market Cap Relative to Realized Value: When MVRV (Market Value to Realized Value) scores exceed 5, it indicates that Bitcoin prices are significantly higher than the average purchase price, often signaling an overheated market.”
VanEck was brief on this point, and to be honest, MVRV isn’t a metric I typically rely on to gauge if the market is nearing a top. In fact, I mostly glossed over the concept until today, when I came across it in Lyn Alden’s latest newsletter, “The Rise of Digital Assets,” where she dedicated a detailed segment on this very metric.
It then occurred to me that if both Lyn Alden and VanEck are focusing on MVRV, that’s a strong enough signal for me to take notice. With that in mind, let’s dive into what this metric is all about and explore what it indicates about Bitcoin’s current position in the cycle.
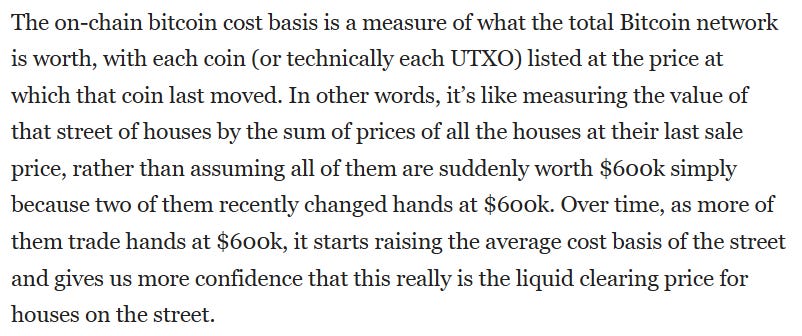
Here’s where it starts:

What Lyn Alden explains next is that as a few houses on a street sell for $600k, it can cause the perceived price of all the houses to ‘reset’ to $600k, even though only a small percentage of homes have sold at that price. Prices are influenced by the most recent transactions, and the market capitalization of the entire street can increase based on these sales. However, just because some houses sell at that price doesn't mean all homes will automatically sell for $600k, as it’s important to see sustained transactions over time. If more homes continue to sell at that price, it gives a clearer indication that $600k is indeed the new market price.
Using this simple analogy, we can apply the same logic to Bitcoin, although it's important to recognize that Bitcoin is far more liquid and ubiquitous than homes.
Here’s where Lyn Alden begins the Bitcoin comparison:
In the chart below, there are a few key elements to note. The black line represents the market capitalization of Bitcoin, the blue line shows the cost basis of the network, and the orange line represents the MVRV Z-score, which measures the deviation between the market cap (black line) and the cost basis (blue line).

Here’s a second explanation from Bitcoin Magazine. I find it helpful to read new concepts a couple of times from various authors for the concept to stick.
“The MVRV Z-score has historically been very effective in identifying periods where market value is moving unusually high above realised value. These periods are highlighted by the z-score (orange line) entering the pink box and indicates the top of market cycles. It has been able to pick the market high of each cycle to within two weeks.
It also shows when market value is far below realised value, highlighted by z-score entering the green box. Buying Bitcoin during these periods has historically produced outsized returns.”
In a bull market, Bitcoin's market capitalization often rises well above its on-chain cost basis, which can signal the need for caution, although it doesn't provide a definitive top signal. In a bear market, Bitcoin’s market capitalization tends to fall below its cost basis, which has historically presented strong buying opportunities.
When comparing our current position to previous cycle tops, the current Bitcoin MVRV Z-Score stands at 3.31. This is notably lower than the peak scores recorded in past cycles, which reflected the greatest discrepancies between market capitalization and on-chain cost basis. At this level, Bitcoin is positioned roughly in the middle of its historical range, indicating we are neither at a major peak nor at the cycle's lowest points.
Some notable highs that this score has reached in the past include:
February 2021: 7.13
December 2017: 10.04
November 2013: 9.49
Keep in mind, the historical scores may change this cycle if Bitcoin’s market cap rises even further above its on-chain cost basis than it has in the past.

To wrap up this segment, it’s important to note that while the MVRV Z-Score is a valuable tool, it should be used in conjunction with other widely-followed metrics for more technical investors.
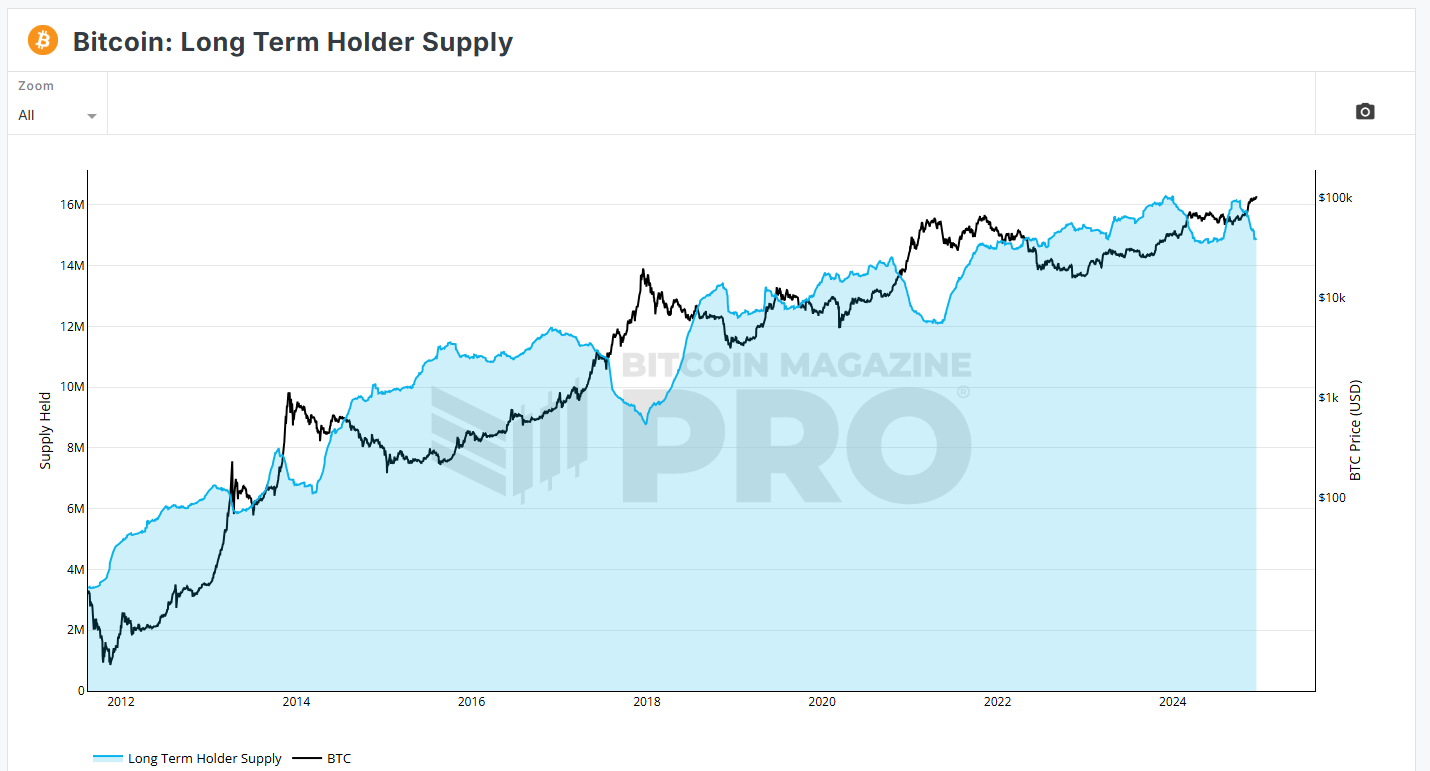
I like to keep things simple by focusing on a few key indicators. My main areas of attention include Bitcoin dominance dropping to around 40%, Google Search trends reaching a score of 50 to 100, and a noticeable divergence in the long-term holder supply (illustrated below).
I’ll also be watching for 95% to 100% of Bitcoin's supply to be in profit and the appearance of multiple yellow and green dots on the Stock-to-Flow (S2F) chart. These are my preferred metrics, which I combine with technical, fundamental, and sentiment analysis—a more subjective art that takes time to master.
If this all feels unfamiliar, consider making it this week’s homework to explore on-chain data and get acquainted with these metrics. Relying on gut feelings to gauge the market's position is no better than walking into a casino and randomly guessing which slot machine to play—it’s a losing strategy every time.
A solid starting point is Lyn Alden’s most recent newsletter, which is free to read, or simply spend some time on CoinGlass. Begin with some of the metrics that aren't overly complicated and gradually branch out from there.
Very few investors will accurately call the top—that’s just how it goes. In hindsight, it might seem like everyone knew exactly when the peak was, but that’s an illusion. Often, it’s just a case of cherry-picking the one correct prediction out of a sea of bad takes.
For those aiming to take profits, completed sell orders within 20% of the top should be considered a huge success. Since the exact top isn’t clear until after the fact, it’s incredibly challenging to time it perfectly. The best approach is to plan incremental sales at price levels you’re genuinely comfortable letting go of.
There’s nothing quite like watching Bitcoin hit all-time highs. However, I still anticipate a significant rotation of capital toward the major altcoins, like ETH and SOL, once Bitcoin cools off. I believe Q1 will be the time when these altcoins really take off. Beyond Q1, I’ll be keeping a close eye on the metrics mentioned above to assess where Bitcoin stands a few months from now.
Have a great day. $200,000 is next.

Bitcoin Thoughts And Analysis

Key Observations:
Uptrend Confirmation:
Bitcoin has maintained a clear bullish structure, printing consecutive higher highs and higher lows since the start of 2023.
The parabolic move from the $49,000 breakout has led to a sharp rally toward $106,869 (current level).
Key Support and Resistance Levels:
Support:
$100,000 - Key psychological support
$73,835: This is the previous major resistance that has now flipped into support. If BTC pulls back, this level will be critical for maintaining the bullish structure.
Resistance:
No significant overhead resistance exists as BTC is in price discovery. Key psychological levels like $120,000 and $130,000 could act as magnets for price.
Volume:
Volume has been increasing alongside the rally, confirming that this move has strong participation and is not purely speculative.
Sustained volume at higher prices is a bullish sign that the breakout has conviction.
RSI Analysis:
The RSI is currently in the overbought territory (above 70), sitting near 80.
Historically, in bull markets, weekly RSI staying elevated for an extended period is common, so overbought conditions don’t necessarily mean an immediate reversal.
Moving Averages:
50-Week SMA: Trending sharply upward and currently around $73,000, reinforcing it as a key support level.
200-Week SMA: Sits far below around $49,000, marking the long-term bull/bear cycle boundary.
Key Thoughts:
Parabolic Move and Healthy Pullback:
Bitcoin’s sharp rally suggests we are entering the euphoric stage of the bull market, where strong upward moves can happen in a short period.
However, parabolic moves often lead to steep pullbacks for reaccumulation. A retest of the $73,835 support zone would be healthy and expected.
4-Year Cycle Alignment:
This move aligns with the Bitcoin 4-year halving cycle. Historically, BTC experiences significant upward momentum in the year leading up to and after the halving.
If the pattern holds, Bitcoin could target new highs over the next 6–12 months.
Price Discovery Mode:
With BTC breaking above all historical levels, there is no technical resistance to cap price movement.
Psychological levels such as $120,000 and $150,000 could act as round-number resistance targets.
Bitcoin remains firmly bullish on the weekly chart, with price discovery underway and no historical resistance. While short-term overbought conditions suggest caution, the macro uptrend remains intact as long as BTC holds above $73,835. Dips into key support zones should be viewed as buying opportunities. Long-term targets include $120,000–$150,000 if the 4-year cycle continues to play out.
Altcoin Charts
For those who are new here, I share SETUPS and not SIGNALS. These are ideas that I am watching - if a certain thing happens, then the trade triggers. I am not telling you what to buy or when. I am showing you how I am watching certain charts and what has to happen for me to take a trade.

Weekly Analysis of Cardano
New Key Levels:
Resistance:
$1.26: Price recently hit this level and is currently struggling to close above it. This is a significant resistance zone and aligns with the 2022 price action.
$3.10: Long-term target and all-time high, marking the next major resistance if price sustains above $1.26.
Support:
$0.81: Previous major resistance, now acting as key support. A retest here would be a healthy pullback while maintaining the bullish structure.
$0.46: Mid-range support, which acted as resistance during accumulation before the breakout.
$0.23: Historical bear market low and ultimate downside support level.
Key Observations:
Breakout Confirmation:
The price exploded out of a multi-month accumulation range between $0.23 and $0.46, and surpassed the major breakout level at $0.81.
The breakout was accompanied by increasing volume, confirming strong bullish momentum.
Current Consolidation:
Price is now consolidating near $1.26, showing initial rejection at this resistance zone.
The structure remains bullish as long as price holds above $0.81. Any pullback to this level would likely act as a buying opportunity.
Volume:
Volume surged on the breakout, confirming strong buyer interest.
Current volume has tapered off slightly, indicating consolidation.
Moving Averages:
The 50-week SMA (blue line) is trending upwards, acting as dynamic support around $0.46.
The 200-week SMA (red line) is flattening near $0.73, reinforcing the broader bullish shift.
Market Structure:
ADA is showing a clear uptrend with a series of higher lows and higher highs.
The breakout from long-term accumulation and successful reclaim of $0.81 confirms a bullish reversal.
Outlook:
Bullish Case:
If ADA can close above $1.26 on the weekly chart, the next target will be $2.00, with a long-term outlook toward the all-time high at $3.10.
Bearish Case:
If price gets rejected at $1.26, expect a healthy pullback toward $0.81. This would still preserve the bullish structure.
A breakdown below $0.81 would invalidate the current bullish thesis and shift focus back toward $0.46.
Cardano is at a critical juncture near $1.26 resistance. A weekly close above this level would open the door for continuation toward $2.00–$3.10. However, a rejection may lead to a pullback toward $0.81, which would be a key support for re-entry. The overall trend remains bullish, with clear higher highs and volume confirmation of the breakout.
Legacy Markets

Global stocks retreated on Tuesday as investors awaited the Federal Reserve's final interest rate decision of 2024 and its policy outlook. Nasdaq 100 futures dipped slightly after a record-setting rally, while Europe’s Stoxx 600 fell 0.4% due to weaker oil prices. Asian markets also dropped amid lingering concerns over China’s economy. Traders are focused on the Fed’s anticipated quarter-point rate cut on Wednesday, though uncertainty remains about future moves, especially with inflationary risks tied to potential tariffs under Donald Trump’s incoming administration. Money markets currently see an 80% chance of three rate cuts in 2025. In the UK, expectations for Bank of England cuts moderated after wage growth accelerated, causing gilt yields to rise. The yen steadied after a recent sharp decline, though concerns over its weakness persist, while Asian currencies fell to a two-year low due to China’s economic pessimism and a stronger dollar outlook. Chinese markets showed little reaction to reports of a 5% growth target and higher budget deficit for 2025.
Key events this week:
UK CPI, Wednesday
Eurozone CPI, Wednesday
US rate decision, Wednesday
Japan rate decision, Thursday
UK BOE rate decision
US revised GDP, Thursday
Japan CPI, Friday
China loan prime rates, Friday
Eurozone consumer confidence, Friday
US personal income, spending & PCE inflation, Friday
Some of the main moves in markets:
Stocks
The Stoxx Europe 600 fell 0.4% as of 10:19 a.m. London time
S&P 500 futures fell 0.3%
Nasdaq 100 futures fell 0.1%
Futures on the Dow Jones Industrial Average fell 0.3%
The MSCI Asia Pacific Index fell 0.5%
The MSCI Emerging Markets Index fell 0.8%
Currencies
The Bloomberg Dollar Spot Index rose 0.1%
The euro fell 0.3% to $1.0484
The Japanese yen rose 0.3% to 153.72 per dollar
The offshore yuan was little changed at 7.2917 per dollar
The British pound was little changed at $1.2680
Cryptocurrencies
Bitcoin rose 1% to $107,083.83
Ether fell 0.8% to $4,016.04
Bonds
The yield on 10-year Treasuries advanced two basis points to 4.42%
Germany’s 10-year yield declined one basis point to 2.23%
Britain’s 10-year yield advanced six basis points to 4.50%
Commodities
Brent crude fell 0.7% to $73.41 a barrel
Spot gold fell 0.4% to $2,642.41 an ounce

German Finance Minister Pleads For Bitcoin

After being fired by German Chancellor Olaf Scholz, former Finance Minister Linder addressed the nation, warning of looming economic collapse and the missed opportunity of Bitcoin. In his remarks, quoted below, Linder openly criticized those who ignored Bitcoin, even name-dropping those he believes are most responsible for the blunder—a baller move.
“Listen to what's happening in the world. What innovations are taking place that are passing Germany by? I haven't heard from the chancellor, the minister of economics, or the opposition leader that a new crypto-friendly policy is indeed being implemented in the U.S.A., and that the U.S. certainly wants to surpass the advantages we could also have with Bitcoin. And I hear nothing about it in a central debate in the German Bundestag. What a failure, what an opportunity being missed.”
When Will Saylor Reach 1 Million BTC?

Saylor bought more—standard stuff. I went ahead and compiled the last 20 Bitcoin purchases MicroStrategy made to calculate the mean number of Bitcoin purchased. Here they are written out; you’ll notice the minimum of the group is 33 and maximum is 55,500: 15,350; 21,550; 15,400; 55,500; 51,780; 27,200; 7,420; 18,300; 169; 11,931; 122; 33; 9,245; 12,000; 3,000; 850; 14,620; 16,130; 155; 5,445. The mean of the group is 14,310 Bitcoin per purchase.
That means if MicroStrategy continues to buy Bitcoin at its average rate, with 439,000 BTC already in its possession, it would reach 1 million Bitcoin after 39 more purchases of 14,310 BTC each. It’s an interesting thought, but also speculative, considering that this data set only includes the 20 most recent purchases. Furthermore, it’s uncertain whether Saylor will be able to maintain both the purchasing power and the amount of Bitcoin acquired in tandem, or if they will diverge, likely resulting in fewer Bitcoins being acquired for more money.
Ripple’s Stablecoin Launches Today!
")
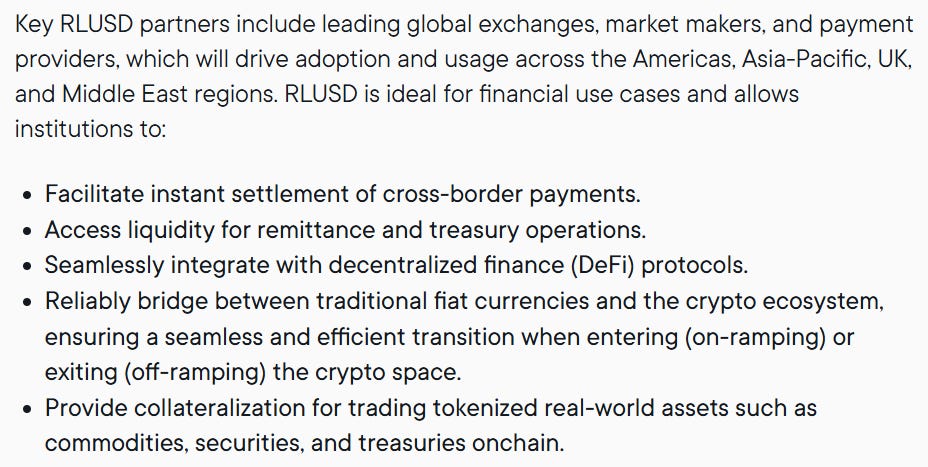
Ripple’s new stablecoin, RLUSD, will be available on global exchanges starting today, December 17, 2024. For those not following the story, RLUSD is an enterprise-grade, USD-denominated stablecoin fully backed by US dollar deposits, US government bonds, and cash equivalents, according to Ripple’s press release and will publish monthly third-party attestations.
For those looking to buy RLUSD, it will initially be listed on Uphold, Bitso, MoonPay, Archax, and CoinMENA, with additional platforms such as Bullish, Bitstamp, Mercado Bitcoin, Independent Reserve, and Zero Hash expected to follow in the coming weeks. Below is a quote from CEO Brad Garlinghouse, which was included in the official press release.
“Early on, Ripple made a deliberate choice to launch our stablecoin under the NYDFS limited purpose trust company charter, widely regarded as the premier regulatory standard worldwide. As the U.S. moves toward clearer regulations, we expect to see greater adoption of stablecoins like RLUSD, which offer real utility and are backed by years of trust and expertise in the industry.”
Ether.Fi Explores Token Buybacks

Yesterday, I covered the explosive growth that Ethereum liquid restaking protocols have experienced in 2024, noting that Ether.fi leads the liquid restaking market, controlling over 50% of TVL with $9.17 billion in restaked assets, according to DefiLlama. Today, I want to expand on Ether.fi because it was just announced that the protocol has proposed allocating a portion of protocol revenues to buy back native ETHFI tokens and distribute them to stakers as a reward.
Here’s the official text from the proposal:
“We propose allocating 5% of protocol revenue to buy ETHFI and distribute it to ETHFI stakers as a reward, further incentivizing long-term staking while maintaining and expanding the buyback and LP program. The initiative aims to enhance the utility of ETHFI, strengthen its market, and align user incentives with the growth of the Ether.Fi ecosystem.”
You can read the full proposal HERE.

Bitcoin Hits $106K: Record-Breaking Rally Ahead Of Crucial Fed Announcement | Macro Monday
Join Dave Weisberger, Mike McGlone, and James Lavish as we break down what's happening in macro and crypto!
My Recommended Platforms And Tools
Aptos - The blockchain network with everything you need to build your big idea. Unrivaled Speed, Unprecedented Trust, and an Unstoppable Community on Aptos.
Phemex - Join me on Phemex and unlock up to 30,000 USDT in exclusive rewards! Phemex is the most efficient crypto trading and investment platform. MY LINK
Arch Public - It’s a hedge fund in your pocket. Built for retail traders, designed to outperform Wall Street. Try emotionless algorithmic trading at Arch Public today.
Trading Alpha - Trade With Confidence! My new go-to indicator site and trading community. Use code '10OFF' for a 10% discount.
X - I spend most of my time on X, contributing to CryptoTownHall every weekday morning, sharing random charts, and responding to as many of you as I can.
YouTube - Home of the Wolf Of All Streets Podcast and daily livestreams. Market updates, charts, and analysis! Sit down, strap in, and get ready—we’re going deep
The views and opinions expressed here are solely my own and should in no way be interpreted as financial advice. Every investment and trading move involves risk. You should conduct your own research when making a decision. I am not a financial advisor. Nothing contained in this e-mail constitutes or shall be construed as an offering of financial instruments or as investment advice or recommendations of an investment strategy or whether or not to "Buy," "Sell," or "Hold" an investment.