


The Wolf Den #100 - WHAT AN AMAZING TRIP IT HAS BEEN!


Bitcoin Thoughts And Analysis
Little has changed on the Bitcoin chart since Tuesday (and even since last week). I am not trading it right now until I see some more definitive move on larger time frames. Let's take a look at what is happening.
MONTHLY CHART
Well played, sir. Bitcoin managed to close above the key $10,540 level that we have been watching for months. The August candle tested it perfectly as support. I have beat this dead horse, but that line made a macro higher high and broke the local bear market. We want to see monthly candles continue to close above that. I also like the nice long wick on the last monthly candle - it shows lots of buying and demand.
A month ago I shared the possibility of a bear div with RSI on the monthly chart. It confirmed. But I am not worried. Why? Because it's the monthly chart. The stock market can carry monthly bear divs for literally years without seeing them play out. IF THIS EVEN is an issue, it could take many more candles to have an effect. The monthly chart is just too high of a time frame for really major concern. It's worth keeping tabs on, but I don't think that it is tradable information at all, because it will take so long to see what happens.
DAILY CHART
No change. Above the blue box would be a nice confirmation of bullish action - you can see it's a clear support to resistance flip. Red box shows lots of demand. I personally want to see this break and test the blue zone as support.
Same chart. The break of the triangle will likely determine the next larger move.
IntoTheBlock - The Short EXM Story And It’s Impact On Yearn.Finance
In this report, we bring to you the latest in on-chain cryptocurrency analysis. We look at the blockchain directly and analyze balances, transactions, and the overall activity of market participants, which gives us a unique insight into the future of the market.
This section is written in conjunction with IntoTheBlock (ITB). ITB is an intelligence company that leverages machine learning and advanced statistics to extract intelligent signals tailored to crypto-assets. IntoTheBlock tackles one of the hardest problems in crypto: to provide investors with a view of a crypto asset that goes beyond price and volume data.
The Wolf Den research team uses IntoTheBlock to dig deeper and get the most important insights about the crypto market.
This Week: The Short EXM Story and It’s Impact on Yearn.Finance
Just another week in crypto. On September 29, Andre Cronje, the founder of Yean.Finance deployed the contract of its new economy for a gaming multiverse concept, called Eminence.
Andre deployed the contract of the untested Eminence product, using Yearn’s account, allowing people to identify it. Although Andre has expressed before that he usually deploys contracts to continue the development, and which according to him, Eminence is at least ~3+ weeks still away, it created a twitter frenzy.

After Andre “went to sleep”, the Twitter hype went crazy, and roughly $15 million were deposited into the EXM protocol. Shortly after that, the contract was exploited and drained of the full 15 million, but more weirdly, the hacker returned $8 million of the funds stoled to Cronje’s yearn developer account.
The people that deposited into the EXM contract lost all of their money, with Andre stating that the Yearn treasury will assist in refunding users back the $8 million he received from the hacker according to a snapshot of EMN balances prior to the hack.
The hack resulted in $15 million dollars stolen, but more importantly, YFI crashed 20% shortly after that.
Using some of the IntoTheBlock indicators, we will analyze the effect of the recent hack in Yearn.Finance’s token YFI.
1.The number of addresses that transferred out all of their YFI tokens reached a new high.
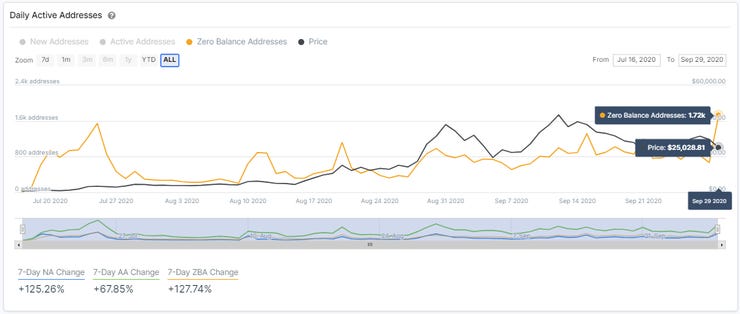
LINK TO THE ABOVE CHART: YFI Addresses Stats
By looking at Zero Balance Addresses — addresses that transferred out all of their tokens on a given day — we can confirm that with the recent crash in YFI price crash, many holders either sold or transferred all of their stake immediately.
On September 29, a total of 1,720 addresses sold their stake.
2. Inflows into centralized exchanges confirm the liquidation thesis

LINK TO THE ABOVE CHART: YFI Exchanges Inflow Volume Chart
By tracking exchanges inflows, IntoTheBlock is able to determine the amount entering centralized exchanges. This provides an idea of how exchanges’ token holdings change over time.
The same day the EXM hack occurred, there was a massive inflow of YFI volume entering centralized exchanges to be liquidated. From the 29,968 YFI tokens in circulation, 1,140 YFI were deposited into some of the top centralized exchanges.
3. The recent crash affected the profitability of YFI Holders.

LINK TO THE ABOVE CHART: YFI In/Out of the Money Stats
IntoTheBlock’s Historical In/Out of the Money (HIOM) indicator analyzes investors’ on-chain positions based on addresses’ average cost for a given token, in this case YFI. Based on this, the HIOM calculates the percentage and total number of addresses that are “in the money”, or profiting on their paper positions (unrealized profits). By comparing variations in the HIOM over time, we can determine buying/selling activity based on the number of addresses profiting at a specific price level.
At the time of writing, 24.69% of Yearn.Finance addresses are making money in their position (on paper at least) at a price of $22,898.59. This means that the number of YFI addresses profiting decreased by 22% following the recent EXM, moving in tandem with the price action.
Altcoin Charts
The altcoin market is still choppy and difficult to trade. That said, we have still found some opportunities to profit. ALGO, SNTVT and SUSHI are all up from the setups on Tuesday and have played out just as the charts showed was likely.
Also, I have not included an educational trade review this week because I have not taken and completed any trades that I can review! I will go back to doing that soon, as I know it's a very popular section now.
For those of you who are new, these are NOT signals and I am NOT telling you to buy them now. I try to provide educational setups, to show how I am looking at trades and what would make me take them IF CERTAIN THINGS HAPPEN. I want people to use these in their own system, but NEVER FOMO into them just because I posted them. It's possible that literally none of these will trigger or play out.
ALGO/BTC
This is an UPDATE of a trade that I have shared an number of times. We had the clear break of the blue descending wedge, a retest of the top line as support and then a break of the horizontal resistance. I have been in since around 3000. We may have already had the retest that I drew! But if it comes down to 3165 again, that could be a great entry - and you can use a relatively tight stop (maybe below 3000) and take a small loss if this does not play out. If Bitcoin remains stable, this "should" continue up.
ANKR/BTC
This is up about 60% from when it was last discussed here, on the break of the descending white line. It has played the levels that I shared perfectly, and is currently finding support at 70. I bought there, and am looking for a target around 85. Very simple. I would exit on a candle close below 70, and have a stop way below that in case of a wick.
DOT/BTC
I am already in DOT from below, on the break of that small black descending wedge. It has since formed an ascending blue support that I would like to see hold, and would consider a reason to exit if it breaks.
I have an alarm set on the descending blue line, which would be the trigger for another trade on this pair. Nothing else before that is of interest to me. A break or ideally break and retest of that top blue line is what I am looking for. The target of that move would be the top of the blue line.
Fib levels can be used as targets.
SXP/BTC
A subscriber asked me to look at this as a chart request, but I chose to bring it up here as a setup that I will be watching.
SXP has been disappointing and has failed on a number of bullish setups. That said, we had a clear break from the red descending wedge, which was a great point of entry. Now it appears that price is consolidating in a small bull pennant (blue triangle). The targets are shown in blue and grey, depending on how you choose to measure the flag pole. Important to remember - bull pennants often break support and become bull flags, which are descending channel. So the best trade is a break of the TOP blue line. That is considered the confirmation. An even better entry is a retest of that line as support, if it happens.
This is also currently testing a key horizontal level, as of when I composed the chart.
THETA/BTC
Multiple subscribers also asked me to look at this as a chart request, but I chose to bring it up here as a setup that I will be watching.
I have not taken this trade myself, to be transparent. Technically though, price is retesting the all time high here as support, which is usually a great entry on any asset. Other key levels are marked, if this breaks support and you are looking for a lower entry.
You can see that all 3 EMAs are screaming upwards - usually price eventually will test these again, but that does not need to happen any time soon and they can certainly catchup. The blue ascending support is really steep, and we would like to see that hold. A bounce off of that would be an entry I would be interested in, because you could use a relatively tight stop and take a small loss if if breaks.
For those who want to trade this, from a technical perspective, 6400 is a "good" entry.
UNI/BTC
Multiple subscribers also asked me to look at this as a chart request, but I chose to bring it up here as a setup that I will be watching.
I am still in UNI with part of my previous position from the trade that I shared a while back. You can see that here.
My stop were below the red line, so I have never seen a reason to exit with what's left of the position. I took profit above a few times.
Right now we have a clear descending resistance (blue) that just rejected price. I am NOT adding to this position UNLESS THAT LINE BREAKS. So don't go buying this right now, it's floating between resistance and support. I would also consider an entry from the bottom ascending blue line if that hits. The target of a breakout of that top line would be back around the recent highs at the top of the descending blue lin.
Legacy Markets
AltcoinPsycho provided some amazing trades on Tuesday - 2 of the 3 were up 10% within hours of the setups being presented. Today I have no new trades, but want to update you on the DXY (dollar index), because I've had it nailed now for months.
DXY (DOLLAR INDEX)
The dollar is driving the price of nearly every asset on the planet, including stocks, metals and bitcoin. Dollar up, everything else down. Dollar down, everything else up. It is what it is for the moment, although Bitcoin has less correlation here than everything else. Here is a chart showing the inverse movement of DXY and BTC - crystal clear.
Everyone has been in a full panic about "dollar strength" for the past few weeks. I calmly have pointed out COUNTLESS TIMES that the dollar broke a decade long support and would most likely come up to retest it as resistance. That happened last month - and right when it appears that the DXY would break back into the channel, it closed RIGHT AT RESISTANCE. Anything can happen, but technically this looks like a likely rejection for the dollar. If so, it should be in a long and sustained downtrend - which is exactly what the government wants to help pump the markets.
Here is the daily chart that I have posted for the past week, showing what I expected. As everyone began to get bullish, I believed we would likely see a rejection and that it would lose horizontal support and drop. So far, that is exactly what has happened.

The Trader's Mantra

I love this tweet, and often find myself choosing to share Mr. Anderson's ideas. These could be etched in stone as the 9 commandments of trading.
Use risk management: Risk management is the key to everything. A proper stop loss and well calculated position size will make you a profitable trader. Period.
Trust my TA: The only system that can work for you is YOUR OWN. You cannot randomly take trades from other people and hope that they will work out. Your financial situation, portfolio size, expectations and other factors are not the same as theirs. You can borrow the ideas from a setup and then make them work for you. To that end, trust your own ideas and analysis and trade accordingly
Have a trading plan: Never take a trade without knowing exactly where the idea is invalidated (stop loss) and where you intend to take profit. You should have a similar plan for every trade, which becomes your system.
Take responsibility for my trades: You and ONLY YOU are responsible for your financial decisions! If you lose, it is your fault. If you make money, it is your accomplishment to celebrate. Own it! Once you truly stop blaming others for your losses (and issues in life, for that matter), you can become an absolute machine in trading.
Never "hope": Hope is not a strategy. You need a plan and the ability to execute it with military discipline and precision. If you let hope seep in, you will move your stop loss to avoid or loss, or fail to take profit according to plan and let it ride a "little longer."
Never long resistance: Be patient and wait for resistance to break. You can buy that break out or the retest. Longing resistance is an amateur move. Wait for confirmation!
Never short support: Be patient again! Wait for a break. Support is for buying with a tight stop loss, not for selling. Often the urge to sell hits right when something is at support - funny how that works.
Always cut losses: I wrote about this on Tuesday! The key to longevity is cutting losses quickly. You do not need to be right, you need to be profitable! Letting a loser run is a form of hope and is driven by the urge to avoid being wrong. Admit your trade is a failure early and often and move on.
Learn from every loss: Keep a journal! Review your losses and see why they went wrong. Could you have moved your stop a bit lower and reduced your position size? Are you getting stopped out right before price reverses repeatedly? You have to learn from your mistakes to avoid making them again
McGinley Dynamic + Know Sure Thing Trading Strategy
Written by my mentor, Christopher Inks.
The Indicators
McGinley Dynamic Indicator – John R. McGinley, a Certified Market Technician, developed this indicator because he recognized that most people applied moving averages incorrectly. After all, the same moving average will work with varying degrees in different markets across different periods. The goal of this indicator was to be responsive so that it would automatically adjust itself as the market sped up or slowed down. This would give traders a real understanding of the market’s current trend without all the whipsaw and price separation that comes with the various moving averages. Furthermore, while most traders use moving averages as a trading system and/or signal generator, he correctly understood that they should be used as a smoothing mechanism and nothing else.
Know Sure Thing Indicator (KST) – Momentum oscillator developed by Martin Pring that makes rate-of-change readings easier for traders to interpret. Like RSI and the MACD, this oscillator can be used to generate trading signals when KST crosses the signal line and/or the center line. It can also be used to find divergences with price, signaling a possible reversal. It is best used with other indicators to confirm trading signals.
The Problem
The problem with most new traders is that they choose a single indicator and trade solely off it. Unfortunately, this often results in losses that could have been avoided had they added another indicator to confirm the buy/sell signals generated by the first. But you cannot just add any other indicator and expect the profits to roll in. The success of any multiple indicator strategy is choosing the right indicators to pair together. After all, it is not good enough to simply use proper risk management; the next step is to decrease the number of bad trades you make. That way compounding over time is able to exponentially increase your capital account thereby getting you to your goals much sooner.
The Solution
This technique is straight forward. Step 1 is to look for price to cross below, or above, the McGinley line. Step 2 is to wait for the KST to produce a corresponding cross below, or above, the signal line if it has not already done so. Only when this happens should a trade be taken. By waiting for the KST to confirm the price movement, traders are removing a large number of potentially bad trades. You are taking less losses, which means you are decreasing the drawdown on your account that you would need to make up, giving your capital time and opportunity to increase.
Buy Examples

Sell Examples

Want to learn more?
Would you like to learn more great trading techniques like this every week? You can, as well as gain access to intraday analysis of 19 different assets, chart requests, trade setups, and so much more! Learn how to confidently trade all markets effectively and consistently, increasing your profitability! We currently have over 30+ hours of trading education immediately available to our members. I have put together a special deal for readers of this newsletter as a favor to Scott.
You can receive 50% off your first month of Tier 3 access at TexasWest Capital, the industry’s leading trader education and market forecasting service. Join us at howtotradetowin.com and use the coupon code wolfsden50%off at check out to get your discount today. This coupon code is only valid for new members. If you were a previous member of TWC and would like to join again, please send me an email directly at christopher.inks@texaswestcapital.com and I will be happy to send you the same discount as well.
Margin Trading 101
By Sahil Bloom:
If you follow the stock market and financial news, you’ve undoubtedly heard a lot of talk about margin trading or margin calls. But what is margin trading and how does it work? Here’s Margin Trading 101!
First, some definitions. “Buying on margin” is just the financial jargon for using loaned money to buy assets. Someone loans you money and you use it to buy a stock - you are buying on margin. “Margin” is defined as the total value of the asset minus the borrowed amount.
When you buy on margin in a brokerage account, the stocks you buy are collateral. This is the same as buying a house with a mortgage. The house is collateral for the loan. So how does it work and what is the deal with the dreaded margin call? Let’s look at a simple example.
Imagine you want to buy a plot of beachfront land on the coast of Nicaragua. It’s beautiful, but still pretty cheap due to political instability. It’s the next Costa Rica! You’re sure of it. The land costs $1M today. So you ask your rich friend Jimmy for a loan to buy it.
You put up $200K and Jimmy loans you the remaining $800K. You buy the land and are the proud owner of prime Nicaraguan real estate. Congratulations, you just bought on margin! Margin = Asset Value - Loan Value Margin = $1M - $800K Margin = $200K
Shortly after you buy the land, riots break out across the country, causing tourism to grind to a halt. Land values plummet. Jimmy starts to get nervous. He previously had $1M of collateral covering his $800K loan, but now the market value of the collateral is just $500K!
Jimmy calls you, explaining that he needs you to put up some additional cash as collateral to make him whole. Otherwise, he will be forced to seize the collateral (your Nicaraguan beachfront land!) and walk away. This was a “margin call” (literally and figuratively!).
In an alternate universe, if the land value had increased, the returns on your $200K investment would have been amplified given you bought the land on margin. Effectively, buying on margin is a way to amplify returns on the upside, but it also amplifies risks on the downside!
It is essential to educate yourself before entering into a loan agreement (whether for a house or a brokerage account). Never trade on margin if you are going to be in financial distress if you get margin called! So that’s a simple primer on the topic. I hope it was helpful!

JPMorgan Under Fire For Illegal Trades
JPMorgan is gearing up to pay out $920 million in fines after being caught red-handed for illegal trades. An ongoing FBI investigation revealed that over 8 years, 15 high-level traders were “spoofing the market.” This illegal act involves manipulating market order books to deceive traders on the other end giving them a false sense of supply and demand. An intercepted chatroom caught one trader bragging about his success as “a little razzle-dazzle to juke the algos...” So, it ends with JPMorgan paying the largest fine ever imposed by the CFTC. The fine is clearly tiny relative to the earnings as a result of the bad behavior and, as JPMorgan expects, things will just resume as normal. A quick slap on the wrist.
Kik’s Native KIN Token Found To Be An Unregistered Security
Court rules in favor of SEC in 'initial coin offering' lawsuit against Kik - SiliconANGLE
Kik, a popular Canadian messaging app, has been up against the SEC over an alleged $100 million illegal ICO. After a year of proceedings, a US judge granted the SEC its motion for summary judgment. Effectively, the Kin token was found to have failed the famous Howey Test, thus classifying the token as an unregistered illegal security. It was even revealed that early investors were knowingly purchasing a security from Kik because it was advertised as such. It was determined from the Howey Test that buyers of KIN were essentially investing in Kik with an expectation of profit. It took over a year for the court to rule whether it was a security. The Wolf Team doesn’t expect other pending security cases ie. Ripple’s XRP to become clear anytime soon. Don't expect clarity to come quickly.
To be fully transparent, I was very excited about KIN and still have holdings in this coin! The judgement was disappointing, but not unexpected.
A Note From My Assistant...
I wanted to take a moment to congratulate you on achieving 100 Newsletters. I remember congratulating you when you hit 100K followers on Twitter and you shrugged it off as another day, your 100th newsletter, on the other hand, is an achievement you are viewing entirely different and it isn't unnoticed.
I have watched you struggle the past two weeks brainstorming the best way to give back to both your subscribers and sponsors without taking a moment to pat yourself on the back. This is something only a few people will see and something that shouldn't go unnoticed. Working behind the scenes, I witness how motivated and determined you are waking up at ungodly hours and staying up way too late at night looking for trades, writing lessons, and searching for important news. I wrote this a day before seeing the letter but already know (by virtue of who you are) that the intro and contents will be about giving back and thanking everyone because that is who you are. So, I took a moment to share my perspective, congratulate, and thank you for all you have given to your subscribers and me.
Congratulations and Cheers to Many More,
Adam

The Wolf Of All Streets Podcast Ft. Justin Blau
Justin Blau, aka 3LAU, is a world-renowned DJ, best known for his chart topping hits and unique DJ style. Starting small at college fraternity parties, 3LAU quickly rose to fame, performing at sold out shows around the world. What few know is that Justin is a talented trader and early crypto adopter. Justin and his team are beginning to explore the ways that artists can distribute their work in a decentralized and scarce manner using NFTs. 3LAU is transforming traditional art, looking to give super fans a one-of-a-kind experience, while also raising money for charities along the way.
Justin and I further discuss their similar backgrounds in music, performing and crypto, mixing finance and blockchain into the world of art, learning about Bitcoin from the Winkelvoss twins, NFTs, Kanye West tweets, what blue checkmarks, Yeezys, and Jordans all have in common, who is Blockparty, predatory record labels, mining for gold on asteroids, a shaky dollar, having strong opinions loosely held, the impact of COVID on performers, building schools in Guatemala and more.

Phemex Trading Competition And Discount
This newsletter is sponsored by PHEMEX. To celebrate the 100th issue Phemex is offering a 10% fee discount to all my readers. Sign up with the link above and trade with lower fees right away!
Phemex has been recently added to TradingView, and the team has recently listed several pairs that offer great volatility: UNI, YFI, DOT, LEND, ALGO, etc. I encourage you to check them out - you know that I never endorse a product that I do not use!
The Phemex team has also informed me that they are about to launch a global competition with a prize pool of up to 100 BTC, if you enjoy these competitive events you can lead your own team and aim for the first place, or join an existing team once traders are allowed to register on the 9th of October. I may have a team of my own, we will see!
Electroneum (ETN) Giveaway, Free Crypto!
Electroneum, the newest sponsor of the WOAS Podcast, has decided to give away $5,000 worth of ETN to celebrate my 100th newsletter. WOW! All you have to do is enter through the link above. The giveaway was designed just for my subscribers, and, as you will see, there are no entries at the time of writing this. I made sure it was super easy to enter and worth your time. Spreading the Electroneum message is something that I am very passionate about, as they are directly trying to create a more financially inclusive world. Anyway that I can get my followers involved is a win-win. Good Luck!
Celsius Offering 6.5% APT On ETH
I am proud to say that Celsius have chosen to become a sponsor of The Wolf Of All Streets Podcast! I am using the product now and absolutely love it.
You probably know Celsius as the crypto lending and reward income company. Well, Celsius recently upped their rewards on ETH to 6.5% APY! That means you can earn 6.5% ETH on your ETH… or if you are outside of the US, you can earn up to 8.87% APY in their CEL token. And for the true HODLers, Celsius also offers dollar or stablecoin loans against your crypto, starting at just 1% annual interest. Celsius is giving WOAS followers $20 to open a new Celsius wallet. All you have to do is enter promo code WOLF, then transfer and keep at least $200 worth of crypto in your wallet for 30 days.

Chart Requests
BAND/USDT
BAND looks decent here on the USDT pair. It has retrace over 80% of the last move up, common after a parabolic rise. It seems to have made a clear ascending support (blue), so a break and close below that would be a nice invalidation of any trade. There was also a nice bullish divergence with RSI on the daily that caught the bottom of this move. Bounces off of the blue line have a good R/R for a trade with a relatively tight stop. This will do what Bitcoin does, so it will only go up if Bitcoin is stable or rising - it's a USDT pair.
DMG/BTC
We have almost no price action to go on, at least on the only chart available for this coin on TradingView. Sorry, I can't offer much insight, there's no volume and gaps everywhere. The lines I drew are the best I can do for the moment!
KNC/USD
Really love volume on this pair. Key levels are marked - at resistance now. It seems that price has formed a nice descending broadening wedge, usually breaks to the upside and targets the top of the pattern - 1.45. Personally I would wait for a break of the blue line to consider a position on this, and it will all largely depend on Bitcoin since this is a USDT pair.
KSM/USDT
KSM made a strong move up and is now consolidating. The pattern is interesting - it's somewhere between a symmetrical triangle (bull flag) and descending triangle. I prefer the former. That said, the real direction will likely be determined by a break of either blue line.
A move should be coming soon, all 3 EMAs on this chart are tightening.
MSTR (MICROSTRATEGY)
We all love Mictrostrategy right now after their huge bet on Bitcoin! The chart is interesting, I zoomed way out to the weekly, I hope that is ok and you are not looking for a day trade. There's a clear area of resistance (red box) that aligns with a huge descending resistance from the 2015 high. We also see resistance at the 50% retracement of that entire move to the lows earlier this year.
Personally, at this point I would look for a break of those areas above and a retest as support - that would require TREMENDOUS patience. But it was strongly rejected there on that big wick up, so we want to so follow through.
As an investor, I think this has long term potential and I see nothing wrong with slowly buying this.
ZRX/BTC
Very tough chart to read, honestly. My last entry was a break of that descending blue line on the left, but I sold long ago and have not looked back. We had the blue trading range form, had a large deviation above but have found support once again at the bottom. Technically, anything above the bottom of the range remains somewhat bullish, or at least neutral. The EMAs are all acting as resistance, although it is currently trying to break the 200 daily EMA now. The EQ of the channel (center dotted line) should be resistance as well. This is just hard to comprehend after that huge move up and strong rejection and drop, so I'm sorry I can't offer anything more concrete.
My Recommended Platforms And Tools
This is where I trade with leverage and can also trade spot with no fees.\
This is where I spend my days teaching and learning! Our Discord group is a one stop shop for everything you need to learn to trade and control your emotions. Feel free to DM me on Twitter or respond to this email for questions.
This is where I invest, commission-free. They now let you earn interest on your Bitcoin held in Voyager, so you can compound while trading. Not only that, you’ll get $25 in free BTC when you download & fund.
Rewards Code: Scott25
I use RoundlyX to buy small amounts of Bitcoin every single day. They automatically round up my credit card purchases (with 10x multiplier) and invest them in crypto. Absolutely brilliant. Passively invest money you don’t need without a thought. Further, they have integrated with Voyager (see above) to offer commission-free purchases.
Rewards Code: WOLF
This is one of the main places where I hold crypto to gain interest. Celsius also offers dollar or stablecoin loans against your crypto, starting at just 1% annual interest. Celsius is giving WOAS followers $20 to open a new Celsius wallet. All you have to do is enter promo code WOLF, then transfer and keep at least $200 worth of crypto in your wallet for 30 days.
My preferred crypto tax software.
Binance is finally available in Florida!
Self-Directed IRA for Americans - allows you to invest in Bitcoin and any other asset for your retirement, with all of the tax benefits of a normal IRA.
Concierge Phone Service for Americans that protects your from SIM Swaps and other phone related hacks. I cannot stress enough how amazing this service is.
Follow me on Twitter at @scottmelker. This is where I am constantly updating my trades and sharing ideas.
On-chain and fundamental analysis, research, predictions and indicators, all in one place. Highly recommend.
The views and opinions expressed here are solely my own and should in no way be interpreted as financial advice. Every investment and trading move involves risk. You should conduct your own research when making a decision. I am not a financial advisor.